Exploring bivariate numerical data
Assessing the fit in least-squares regression
Learn to evaluate how well least-squares regression lines fit data by analyzing trends, interpreting scatterplots, and calculating correlation coefficients. Develop critical skills in statistical data analysis.
200+ videos and assessments
Standards aligned
Vetted by experts
VIDEOS

Residual plots
Khan Academy
•10th - 12th Grade
•10 Qs

R-squared or coefficient of determination
Khan Academy
•9th - 12th Grade
•10 Qs
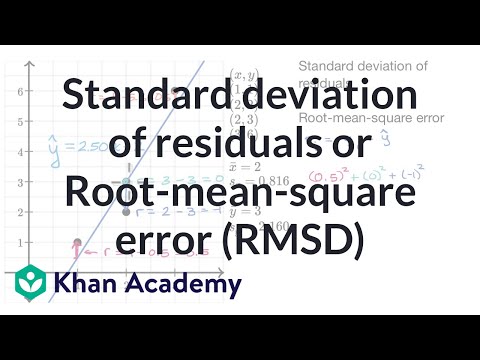
Standard deviation of residuals or Root-mean-square error (RMSD)
Khan Academy
•9th - 12th Grade
•10 Qs
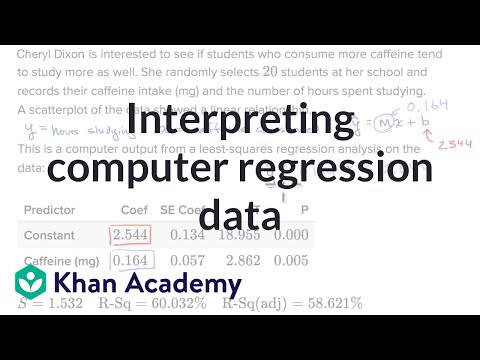
Interpreting computer regression data
Khan Academy
•9th - 12th Grade
•10 Qs
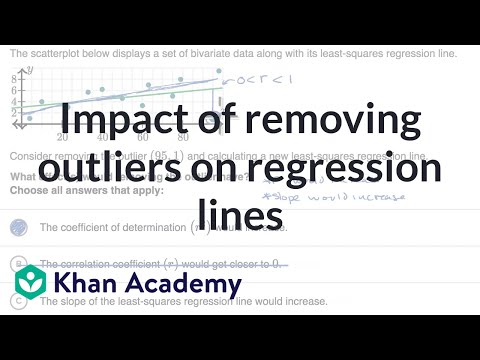
Impact of removing outliers on regression lines
Khan Academy
•9th - 12th Grade
•10 Qs
Start adapting your curriculum in minutes.
The best way to create, adapt, and deliver resources differentiated for every student.
