Statistics and probability
Modeling data distributions videos
Explore data trends and patterns by modeling data distributions, developing skills in interpreting histograms, box plots, and measures of central tendency and variability.
200+ videos and assessments
Standards aligned
Vetted by experts
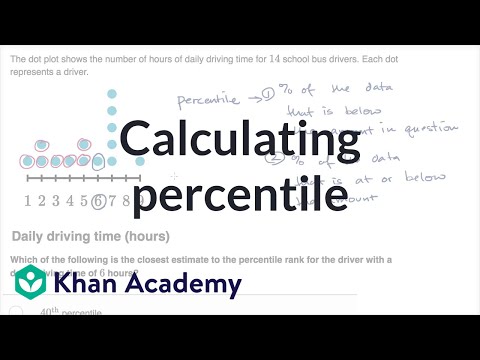
Percentiles
VIDEOS
Z-scores
VIDEOS

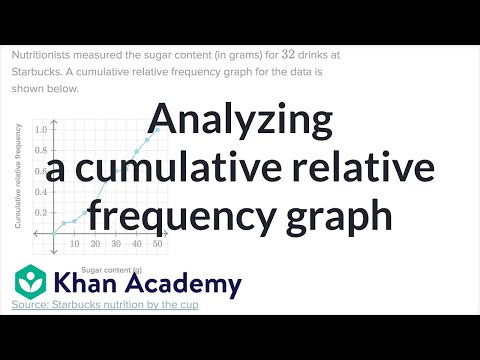
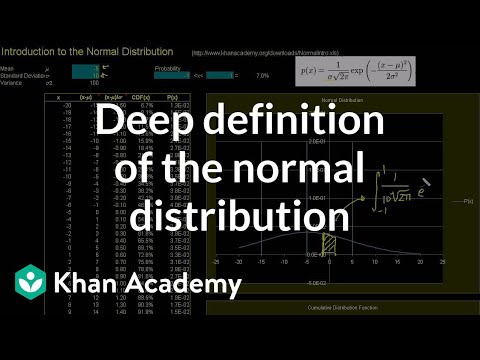
Density curves
VIDEOS

Normal distributions and the empirical rule
VIDEOS
Qualitative sense of normal distributions
Khan Academy
•9th - 12th Grade
•10 Qs
Normal distribution problems: Empirical rule
Khan Academy
•6th - 10th Grade
•10 Qs
Standard normal distribution and the empirical rule (from ck12.org)
Khan Academy
•6th - 10th Grade
•10 Qs
More empirical rule and z-score practice (from ck12.org)
Khan Academy
•10th - 12th Grade
•10 Qs
Normal distribution calculations
VIDEOS

Standard normal table for proportion below
Khan Academy
•6th - 8th Grade
•10 Qs
Standard normal table for proportion above
Khan Academy
•9th - 12th Grade
•10 Qs
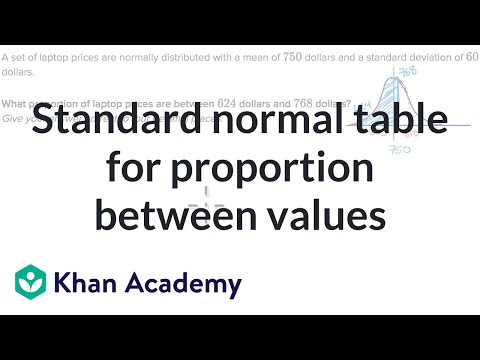
Standard normal table for proportion between values
Khan Academy
•9th - 12th Grade
•10 Qs
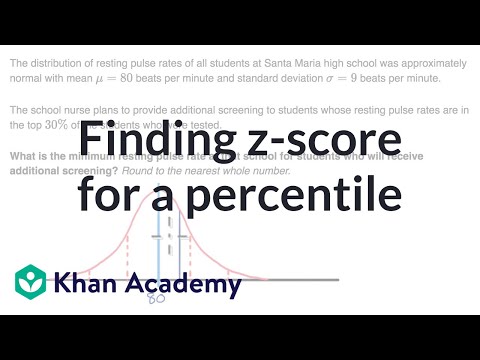
Finding z-score for a percentile
Khan Academy
•9th - 12th Grade
•10 Qs
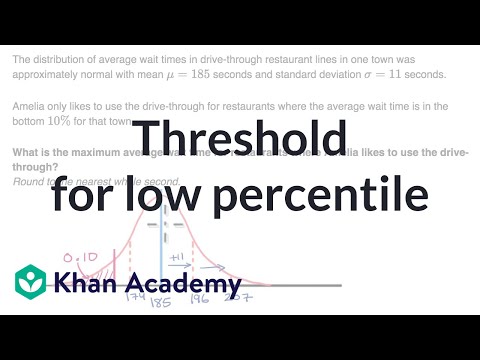
Threshold for low percentile
Khan Academy
•9th - 12th Grade
•10 Qs
Start adapting your curriculum in minutes.
The best way to create, adapt, and deliver resources differentiated for every student.
