Statistics and probability
Summarizing quantitative data videos
Learn to effectively summarize and interpret quantitative data using statistical measures, enhancing your ability to uncover insights and make informed decisions.
200+ videos and assessments
Standards aligned
Vetted by experts

More on mean and median
VIDEOS
Comparing means of distributions
Khan Academy
•7th - 10th Grade
•10 Qs
Means and medians of different distributions
Khan Academy
•9th - 12th Grade
•10 Qs
Impact on median & mean: removing an outlier
Khan Academy
•6th - 10th Grade
•10 Qs
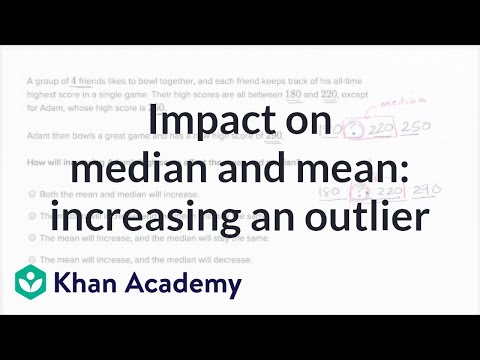
Impact on median & mean: increasing an outlier
Khan Academy
•6th - 8th Grade
•10 Qs

Missing value given the mean
Khan Academy
•4th - 8th Grade
•10 Qs

Median & range puzzlers
Khan Academy
•6th - 10th Grade
•10 Qs

Variance and standard deviation of a population
VIDEOS

Measures of spread: range, variance & standard deviation
Khan Academy
•6th - 10th Grade
•10 Qs
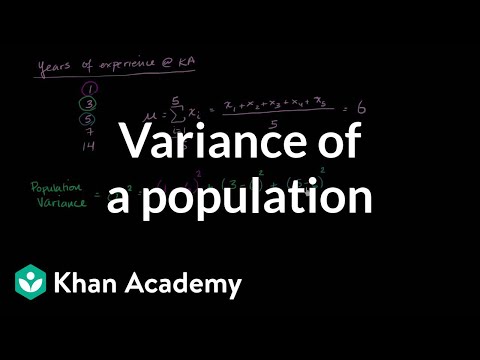
Variance of a population
Khan Academy
•9th - 12th Grade
•10 Qs

Population standard deviation
Khan Academy
•9th - 12th Grade
•10 Qs

Mean and standard deviation versus median and IQR
Khan Academy
•6th - 10th Grade
•10 Qs
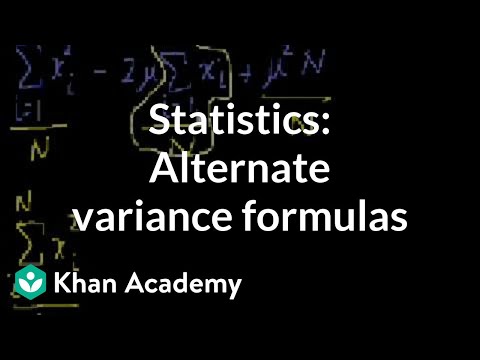
Statistics: Alternate variance formulas
Khan Academy
•10th - 12th Grade
•10 Qs


More on standard deviation
VIDEOS

Why we divide by n - 1 in variance
Khan Academy
•10th - 12th Grade
•10 Qs
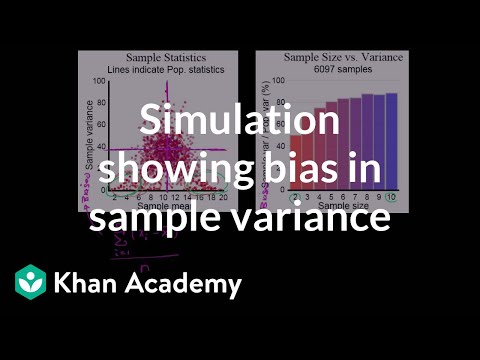
Simulation showing bias in sample variance
Khan Academy
•9th - 12th Grade
•10 Qs
Simulation providing evidence that (n-1) gives us unbiased estimate
Khan Academy
•10th - 12th Grade
•10 Qs
Review and intuition why we divide by n-1 for the unbiased sample variance
Khan Academy
•10th - 12th Grade
•10 Qs
Box and whisker plots
VIDEOS
Worked example: Creating a box plot (odd number of data points)
Khan Academy
•6th - 8th Grade
•10 Qs

Worked example: Creating a box plot (even number of data points)
Khan Academy
•6th - 8th Grade
•10 Qs
Constructing a box plot
Khan Academy
•6th - 10th Grade
•10 Qs

Reading box plots
Khan Academy
•6th - 10th Grade
•10 Qs

Interpreting box plots
Khan Academy
•6th - 10th Grade
•10 Qs
Judging outliers in a dataset
Khan Academy
•7th - 10th Grade
•10 Qs

Start adapting your curriculum in minutes.
The best way to create, adapt, and deliver resources differentiated for every student.
