
Edexcel IAL S1 Chapter 1-5 Revision
Presentation
•
Mathematics
•
11th Grade
•
Easy

Fiona Davidson
Used 12+ times
FREE Resource
8 Slides • 67 Questions
1
2
Open Ended

Statistical models provide a cheap and quick way to describe a real world situation.
Give two other reasons why Statistical Models are used.
3
Open Ended

Seven Stages of Modelling
Stage 1 - The recognision of a real-world problem
Stage 2 -
Stage 3 - Model used to make predictions
Stage 4 - Experimental data collected
Stage 5 -
Stage 6 -Statistical concepts are used to test how well the model describes the real-world problem
Stage 7 -
Describe the missing stage 2...
4
Open Ended
Seven Stages of Modelling
Stage 1 - The recognision of a real-world problem
Stage 2 -
Stage 3 - Model used to make predictions
Stage 4 - Experimental data collected
Stage 5 -
Stage 6 -Statistical concepts are used to test how well the model describes the real-world problem
Stage 7 -
Describe the missing stage 5...
5
Multiple Choice

Tell me the class boundaries of the third group?
6
Multiple Choice
Tell me the class width of the final group?
7
Fill in the Blanks

Type answer...
8
Fill in the Blanks
Type answer...
9
Fill in the Blanks
Type answer...
10
Fill in the Blanks
Type answer...
11
Fill in the Blanks

Type answer...
12
Fill in the Blanks
Type answer...
13
Fill in the Blanks

Type answer...
14
Fill in the Blanks
Type answer...
15
Fill in the Blanks
Type answer...
16
Fill in the Blanks

Type answer...
17

18
Multiple Choice

Which of the options is the correct calculation for the combined mean?
19
Fill in the Blanks

Type answer...
20

21
Multiple Choice

What is the median?
22
Multiple Choice
What is the Interquartile Range?
23

24
25
Multiple Choice

If the variance of a set of data is 25
What is the Standard Deviation?
26
Multiple Choice
If the variance of a set of data is 81
What is the Standard Deviation?
27
Multiple Choice
If the Standard Deviation of a set of data is 100
What is the Variance?
28
Multiple Choice

What position does the median lie in?
29
Multiple Choice

Which value is missing from the box?
30
Fill in the Blanks

Type answer...
31
Fill in the Blanks

Type answer...
32
Fill in the Blanks
Type answer...
33
Fill in the Blanks
Type answer...
34
Multiple Choice
Rearrange to make x the subject
35
Multiple Choice

Mean of x = 36 Mean of y =
36
Multiple Choice
Standard Deviation of x = 4 Standard Deviation of y =
37
Multiple Choice
Mean of x = 11 Mean of y =
38
Multiple Choice
Standard Deviation of x = 27 Standard Deviation of y =
39

40
Multiple Choice

Describe the skew
Mean= 55.48
Median= 56
41
Multiple Choice
Describe the skew
Mean= 5
Median= 4
42
Multiple Choice
Describe the skew
Mean= 3.2
Median= 3.5
43

44
Multiple Choice
Describe the skew
Q1= 8.5
Q2= 13
Q3= 21
45
Multiple Choice
Describe the skew
Q1= 3
Q2= 5
Q3= 8
46
Multiple Choice
Describe the skew
Q1= 4.7
Q2= 7.1
Q3= 7.3
47
Multiple Choice

What are the two missing Frequency Densities?
48
Multiple Choice
What are the two missing Frequencies?
49
Multiple Choice

What are the frequencies of the bars from left to right?
50
Multiple Choice

What is the probability of scoring 7?
51
Multiple Choice

Here are the measurements of 240 koalas.
One koala is chosen at random.
What is the probability the Koala is female?
52
Multiple Choice
Here are the measurements of 240 koalas.
One koala is chosen at random.
GIVEN THAT THE KOALA IS MALE
What is the probability the Koala is less than 70cm long?
53
Multiple Choice

Identify the shaded area...
54
Multiple Choice

Identify the shaded area...
55
Multiple Choice

Identify the shaded area...
56
Multiple Choice

The diagram shows the sports played by 80 students.
If a student is picked at random, what is the probability that they play football?
57
Multiple Choice
The diagram shows the sports played by 80 students.
If a student is picked at random, what is the probability that they play all three sports?
58
Multiple Choice
The diagram shows the sports played by 80 students.
Given that a student selected plays Football.
What is the probability that they play Hockey?
59
Multiple Choice

60
Multiple Choice
61
Fill in the Blanks

Type answer...
62
Fill in the Blanks
Type answer...
63
Multiple Choice

Events A and B are mutually exclusive What is
64
Multiple Choice

What is
65
Multiple Choice
What is
66
Multiple Choice
Are events A and B independent?
67
Multiple Choice

A student is picked at random.
What is the probability the student watches both tv show A and B?
68
Multiple Choice
Determine whether watching tv show A and B are independent
69

70
Multiple Choice
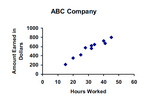
Estimate the correlation coefficient for this scatterplot.
71
Multiple Choice

Describe the correlation in the graph shown.
72
Multiple Choice
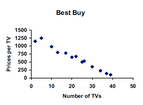
Estimate the correlation coefficient for this scatterplot.
73
Multiple Choice
74
Multiple Choice

75
Multiple Choice

Show answer
Auto Play
Slide 1 / 75
SLIDE
