Search Header Logo
  1. Resource Library
  2. Math
  3. Probability And Statistics
  4. Correlation Vs Causation
  5. Causation
Causation

Causation

Assessment

Presentation

Mathematics

9th Grade

Practice Problem

Medium

CCSS
HSS.ID.C.9, 8.SP.A.2, HSS.ID.C.8

+6

Standards-aligned

Created by

Brandi Wiafe

Used 303+ times

FREE Resource

8 Slides • 10 Questions

1

Causation

Slide image

2

Do Now

Mixed Review

3

Multiple Choice

Which graph shows the best "line of best fit" for the scatter plot?

1
2

4

Multiple Choice

Question image

Estimate the correlation coefficient for this scatter plot.

1

r = 0.85

2

r = 0.45

3

r = -0.45

4

r = -0.85

5

Multiple Choice

Question image

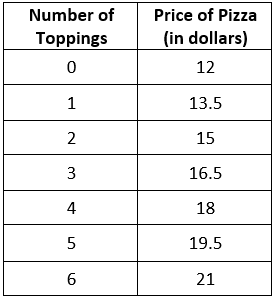
A restaurant sells pizza for the prices in the data table. Calculate the linear regression equation of the data.

1

y = 1.5x + 12

2

y = 12x + 1.5

3

y = 0.67x - 8

4

y = -8x + 0.67

6

Slide image

7

Slide image

8

Slide image

9

Slide image

10

Slide image

11

Multiple Choice

Question image

Which pair best represents a causation relationship?

1

The number of people at the theater and the length of the show

2

The amount of time exercising and muscle growth

12

Multiple Choice

Question image

Which pair best represents a causation relationship?

1

Number of bites and the length of a Twizzler

2

Length of time in the store and the amount of money spent

13

Multiple Choice

Question image

As people’s happiness level increases, so does their helpfulness.

1

Causation

2

Correlation

14

Multiple Choice

Question image

Among babies, those who are held more tend to cry less.

1

Causation

2

Correlation

15

Multiple Choice

Question image

Dogs pant to cool themselves down.

1

Causation

2

Correlation

16

Open Ended

Provide your own example of Causation.

17

Open Ended

Provide your own example of Correlation

18

Slide image

Causation

Slide image

Show answer

Auto Play

Slide 1 / 18

SLIDE