Phase Diagrams and Heating/Cooling Curves

Phase Diagrams and Heating/Cooling Curves

Assessment

Presentation

Chemistry

9th - 12th Grade

Practice Problem

Medium

NGSS
MS-PS1-4, HS-PS3-4, MS-PS1-2

+5

Standards-aligned

Created by

Karen Sorensen

Used 51+ times

FREE Resource

4 Slides • 40 Questions

1

Phase Diagrams and Heating/Cooling Curves

Slide image

2

3

Multiple Choice

Question image
At 0.10 atm, what phase(s) can exist?
1
solid, liquid or gas
2
liquid or gas
3
solid only
4
gas only

4

Multiple Choice

Question image
Below the temperature of point B, this substance can exist as a ____________.
1
solid only
2
liquid only
3
gas only
4
either a solid, liquid or gas

5

Multiple Choice

Question image
What is the normal melting point of this substance?
1
150 °C
2
100 °C
3
-50 °C
4
0 °C

6

Multiple Choice

Question image
What is the normal boiling point of this substance?
1
150 °C
2
100 °C
3
-50 °C
4
0 °C

7

Multiple Choice

Question image
What state of matter is Z?
1
solid 
2
liquid
3
gas
4
supercritical fluid

8

Multiple Choice

Question image
What is the normal boiling point of CO2?
1
-78.5 °C
2
-56.7 °C
3
31 °C
4
It doesn't have a normal boiling point.

9

Multiple Choice

Question image
What is the normal melting point of CO2?
1
-78.5 °C
2
-56.7 °C
3
31 °C
4
It doesn't have a normal melting point.

10

Multiple Choice

Question image
At 10 atm, dry ice is heated from -100 °C to 30 °C.  What changes occur?
1
freezing, then condensation
2
melting only
3
sublimation only
4
melting, then boiling

11

Multiple Choice

Question image
What is true regarding CO2 for temperatures above 31 °C?
1
It can never be liquified.
2
It decomposes.
3
It has a high pressure.
4
It is a plasma.

12

Multiple Choice

Question image
Based on its phase diagram, which is the most dense state for CO2?
1
gas
2
liquid
3
solid
4
supercritical fluid

13

Multiple Choice

Question image
Which statement is true for carbon dioxide at -60 °C?
1
All three phases are possible.
2
It can exist as a solid or a gas, depending on pressure.
3
It is a solid.
4
With enough pressure it can be melted.

14

Multiple Choice

Question image
Water will boil at temperatures above 100 °C at pressures __________ 760 mmHg.
1
below
2
above
3
equal to
4
significantly below

15

Multiple Choice

Question image
The pressure is increased on a sample of water at 0 °C from 0 mmHg to 800 mmHg.  In order, what changes occur?
1
deposition, melting
2
sublimation, melting
3
condensation, freezing
4
deposition, freezing

16

Multiple Choice

Question image
What phase change(s) may occur at pressures below 4.58 mmHg?
1
sublimation/deposition
2
melting/freezing
3
all phase changes are possible at these pressures
4
vaporization/condensation

17

Multiple Choice

Question image
Water exists as a _____________ at 700 mmHg and 50 °C.
1
solid
2
liquid
3
gas
4
supercritical fluid

18

Multiple Choice

Question image
Water exists as a _____________ at 3 mmHg and 50 °C.
1
solid
2
liquid
3
gas
4
supercritical fluid

19

Multiple Choice

Question image
What change occurs from E to C?
1
sublimation
2
freezing
3
melting
4
boiling

20

Multiple Choice

Question image
What is the normal boiling point of this substance?
1
150 °C
2
100 °C
3
-50 °C
4
0 °C

21

Multiple Choice

Question image
What state of matter is Y?
1
solid 
2
liquid
3
gas
4
supercritical fluid

22

Multiple Choice

Question image
What state of matter is X?
1
solid 
2
liquid
3
gas
4
supercritical fluid

23

24

Multiple Choice

Question image

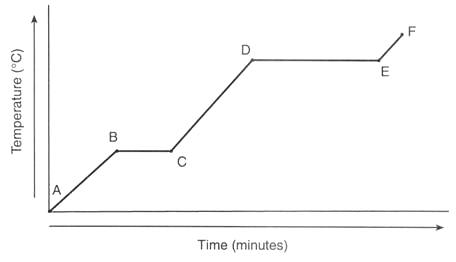
What is the freezing point of the substance?

1

0oC

2

60oC

3

120oC

4

180oC

25

Multiple Choice

Question image

What is the boiling point for this substance?

1

40 °C

2

60 °C

3

120 °C

4

140 °C

26

Multiple Choice

Question image

In which region(s) of the graph would condensation occur?

1

Region A-C

2

Region C-E

3

Region E-G

4

Region G-I

5

Region I-K

27

Multiple Choice

Question image

In which region(s) of the graph would the substance be freezing?

1

Region A-C

2

Region C-E

3

Region E-G

4

Region G-I

5

Region I-K

28

Multiple Choice

Question image

In which region(s) of the graph would the substance be melting?

1

No melting occurs on this graph

2

Region C-E

3

Region E-G

4

Region G-I

5

Region I-K

29

Multiple Choice

Question image

This curve indicates what about the heat energy?

1

Heat energy is being added or absorbed

2

Heat energy is being released

30

Multiple Choice

The freezing and melting points of water are the same.
1
True
2
False

31

Multiple Choice

Question image

The melting point of the sample is

1

-60 ºC

2

-100 ºC

3

60 ºC

4

100 ºC

32

Multiple Choice

Question image
Between which points is the temperature of the substance remaining constant?
1
A-B only. 
2
A-B, C-D, E-F
3
B-C only. 
4
B-C, D-E

33

Multiple Choice

Question image
Describe the substance between letters D and E. 
1
Gas
2
Liquid
3
Melting
4
Evaporating

34

Multiple Choice

Question image
Describe the substance between letters A and B. 
1
Solid
2
Liquid
3
Melting
4
Evaporating

35

Multiple Choice

Question image
In which region(s) of the graph does boiling take place?
1
Region 2
2
Region 3
3
Region 4
4
Region 5

36

Multiple Choice

Question image
In which region(s) of the graph would the substance be a gas only?
1
Region 2
2
Region 3
3
Region 4
4
Region 5

37

Multiple Choice

Question image
In which region(s) of the graph would the substance be a solid and a liquid?
1
Region 1
2
Region 2
3
Region 3
4
Region 4

38

Multiple Choice

Question image
In which region(s) of the graph would the substance be a solid only?
1
Region 1
2
Region 2
3
Region 3
4
Region 4

39

Multiple Choice

Question image
In which region(s) of the graph would the substance only be in one phase?
1
Region 1, 3, & 5
2
Region 2 & 4
3
Region 1 only
4
Region 1 & 2

40

Multiple Choice

Question image
In which region(s) of the graph does a phase change occur?
1
Region 1, 3, & 5
2
Region 2 & 4
3
Region 1 only
4
Region 1 & 2

41

Multiple Choice

Question image
This curve indicates what about the heat energy?
1
heat energy is being added or absorbed
2
heat energy is being removed

42

Multiple Choice

Question image
In which region(s) does temperature increase?
1
Region 1, 3, & 5
2
Region 2 & 4
3
Region 1 only
4
Region 1 & 2

43

Multiple Choice

Question image
In which region(s) does temperature remain constant?
1
Region 1, 3, & 5
2
Region 2 & 4
3
Region 1 only
4
Region 1 & 2

44

That is your lesson on Phase Diagrams and Heating/Cooling Curves.

Make sure to add these conversions to your notes:

1 atm=760 mm of Hg

1 atm= 14.7 psi

1 atm= 101.3 kPa

Phase Diagrams and Heating/Cooling Curves

Slide image

Show answer

Auto Play

Slide 1 / 44

SLIDE