
Interpreting the Unit Rate as Slope
Presentation
•
Mathematics
•
8th Grade
•
Medium

Jenine Shalabi
Used 7+ times
FREE Resource
17 Slides • 21 Questions
1

2
3
Multiple Choice
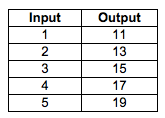
Find the rate of change
4
Multiple Choice

Find the rate of change.
5
6

7

8

9

10

11
Multiple Choice

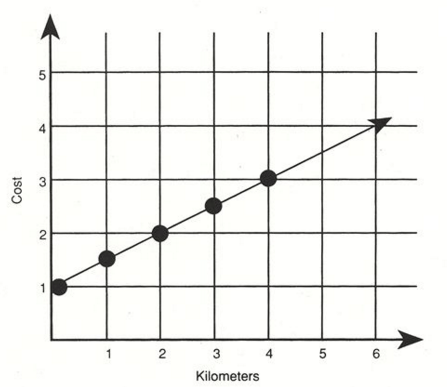
What is the slope in the picture?
12
Multiple Choice

What is the slope in the picture?
13
Multiple Choice

What type of slope is represented in the image?
14
Multiple Choice

What type of slope is represented in the image?
15

16
17

18

19

20
21
Multiple Choice

What does "m" stand for in the slope formula?
22
Multiple Choice
23
Multiple Choice
24
Multiple Choice

Find the slope of the line.
25
Multiple Choice

Find the slope.
26
Multiple Choice

Find the slope
27
Multiple Choice

What is the slope of this graph?
28
Multiple Choice

What is the slope between the two points?
29
Multiple Choice

What is the slope between the two points?
30
Multiple Choice
31
Multiple Choice
32
Multiple Choice
33

34
Multiple Choice

35
Multiple Choice
36

37
Multiple Choice

Is this table proportional?
38

Show answer
Auto Play
Slide 1 / 38
SLIDE
