
Linear Regression 11/10-11/11
Presentation
•
Mathematics
•
9th Grade
•
Practice Problem
•
Easy
Standards-aligned

Paul Haase
Used 46+ times
FREE Resource
13 Slides • 6 Questions
1
Linear Regression 11/10-11/11

2

3
Open Ended

1) Make sure you have access to Desmos.com through a laptop, tablet, or phone
2) Look at the three scatter plots. What do you notice? What do you think each dot represents? Could you draw a line through them?
4

5

6

7
Multiple Choice

Describe the correlation of the data.
8
Multiple Choice

Describe the correlation of the data.
9
Multiple Choice

10

11

12

13
Multiple Choice
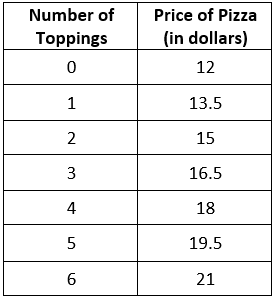
A restaurant sells pizza for the prices in the data table. Calculate the linear regression equation of the data.
14

15

16

17

18

19
Multiple Choice

The linear regression equation that best represents the line of best fit for the data is y=20.8x-35. Use the equation to predict the number of bacteria in 24 hours.
Linear Regression 11/10-11/11
Show answer
Auto Play
Slide 1 / 19
SLIDE
