
STA2023 Final Exam Review
Presentation
•
Mathematics
•
University
•
Hard
+9
Standards-aligned

kd johnson
Used 4+ times
FREE Resource
7 Slides • 41 Questions
1
TCC STA2023 Final Exam Review
K Washington

2
Unit Three: Statistical Inference
Modules 7-9
3
Main Ideas
Find probabilities for sampling distributions of means and proportions
Conduct a hypothesis test for means and proportions
Calculate/interpret confidence intervals for means and proportions
Measurement/sampling biases
Identify statistics, samples, parameters, and populations
4
Multiple Choice
If the p-value is less than α, we reject H0
True
False
5
Multiple Choice
At a particular college, 78% of all students are receiving some kind of financial aid.The school newspaper selects a random sample of 100 students and 72% of the respondents say they are receiving some sort of financial aid. Which of the following is true?
A. 78% is a population and 72% is a sample.
B. 72% is a population and 78% is a sample
C. 78% is a parameter and 72% is a statistic
D. 72% is a parameter and 78% is a statistic
6
Multiple Choice

These symbols represent the mean and standard deviation for which of the following distributions?
A. The Population
B. The Sample
C. The Sampling Distribution
D. Neither
7
Multiple Choice
The mean and standard deviation of a population are 200 and 20, respectively.
What is the probability of selecting 64 data values with a mean between 195 and 200?
A. 41%%
B. 48%
C. 1.5%
D. 0.5%
8
Multiple Choice
The mean and standard deviation of a population are 200 and 20, respectively. Sample size is 25.
What is the standard error of the sampling distribution?
A. 200
B. 16
C. 25
D. 4
9
Multiple Choice
The mean and standard deviation of a population are 200 and 20, respectively. Sample size is 25.
What is the mean of the sampling distribution?
A. 200
B. 16
C. 25
D. 4
10
Multiple Choice
A study found that in a sample of 44 subjects, 9 of agree that children under 6 shouldn’t be taken to nice restaurants.
The 95% confidence interval for p is (0.082, 0.318). Interpret this interval.
A. 95% of the time the proportion of people who believe children under 6 shouldn't be taken to nice restaurants will be between 8.2% and 31.8%.
B. The population proportion of people who believe children under 6 shouldn't be taken to nice restaurants is between 8.2% and 31.8%.
C. The probability that the proportion of people who believe children under 6 shouldn't be taken to nice restaurants will be between 8.2% and 31.8% is 95%.
D. Based on this sample, I am 95% confident that the proportion of people who believe children under 6 shouldn't be taken to nice restaurants is between 8.2% and 31.8%.
11
Multiple Choice
If the 95% Confidence Interval for a population mean is (114.56, 125.54), then is it likely that the true population mean µ is greater than 130?
A. Yes
B. No
C. Not enough information
D. I have no idea what you're asking of me
12
Multiple Choice
A sample size of n = 64 is drawn from a population whose standard deviation is σ = 5.6.
Find the margin of error for a 99% confidence interval for µ.
A. 1.799
B. 1.798
C. 1.803
D. Not enough information
13
Multiple Choice
There is a law in ND saying that the ratio of elementary students to teachers can be no more than 22:1. A hypothesis test is performed to determine if the proportion of schools is above 25% using an SRS of 85 schools. At the 0.05 significance level, what conclusion can be made if 32 of the schools surveyed exceed this ratio?
A. Since the p-value is less than the level of significance level, the null hypothesis should be rejected. There is significant evidence that the true proportion of schools with a higher ratio of more than 25%.
B. Since the p-value is greater than the level of significance level, the null hypothesis should be rejected. There is significant evidence that the true proportion of schools with a higher ratio of more than 25%.
C. Since the p-value is less than the level of significance level, the null hypothesis should not be rejected. There is not significant evidence that the true proportion of schools with a higher ratio of more than 25%.
D. Since p-hat = 0.376 > 0.05, the null hypothesis should not be rejected. There is not significant evidence that the true proportion of schools with a higher ratio is greater than 25%.
E. Since p-hat = 0.376 > 0.05, the null hypothesis should be rejected. There is significant evidence that the true proportion of schools with a higher ratio is greater than 25%.
14
Multiple Choice
Conduct a test to determine whether or not the population proportion of voters in favor of proposal A is greater than 50%. In a random sample of 200 voters, 140 said that they were in favor of this proposal. Compute the test statistic.
A. z = 6.17
B. z = 5.66
C. z = 19.80
D. None of the above
15
Multiple Choice
Tina wants to know if the proportion of people who buy burgers is at all affected by her open mic reading. If p=0.8 before her reading, what is an appropriate set of hypotheses?
A.
Ho: p = 0.8
Ha: p > 0.8
B.
Ho: p = 0.8
Ha: p < 0.8
C.
Ho: p ≠ 0.8
Ha: p = 0.8
D.
Ho: p= 0.8
Ha: p ≠ 0.8
16
Multiple Choice
When leaving for school, you make a judgement on these hypotheses. Ho: The weather will remain dry. Ha: It will rain. What are the results of the Type I and Type II errors?
A.
Type I: Needlessly carry around an umbrella all day. Type II: Get drenched
B.
Type I: Get drenched. Type II: Needlessly carry around an umbrella all day
C.
Type I: Carry umbrella & it rains. Type II: Carry no umbrella & it doesn't rain
D.
Type I: Get drenched. Type II: Carry umbrella & it rains
17
Multiple Choice
Two confidence interval estimates from the same sample are (0.72, 0.83) and (0.75, 0.81). One is at 95%, the other is at 99%. Which is which?
A. (0.72, 0.83) is at 99%
B. (0.72, 0.83) is at 95%
C. Need to know sample size to determine this
D. Need to know standard error to determine this
18
Unit Two: Regression and Probability
Modules 4-6
19
Main Ideas
Calculate LSRL and use it to calculate predictions, interpret slope and y-intercept
Calculate/interpret r and r2
Identify/find probabilities of discrete and continuous random variables
Standard Normal Curve
20
Multiple Choice
Find the area under the standard normal curve that lies to the left of z=2.1.
A. 1.79%
B. -1.79%
C. 98.21%
D. 0.98%
21
Multiple Choice
Mensa International is a non-profit organization that accepts only people with IQ score within the top 2%. What level of IQ qualifies one to be a member of Mensa?
22
Multiple Choice
23
Multiple Choice
Given a continuous data with X~N(30,25). Find P(27<X<32).
0.3446
0.2743
0.3811
0.0703
24
Multiple Choice
Is r = -0.87 strong, moderate, or weak?
strong
moderate
weak
25
Multiple Choice

26
Multiple Choice
In linear regression, the residual refers to the difference between the predicted Y and actual Y values.
True
False
27
Multiple Choice
Linear regression analysis produces an equation of Y = 7 - 3.2X. This indicates that:
An X value of 0 would would increase Y by 7.
A 1 unit decrease in X results in a 3.2 unit decrease in Y.
A 1 unit increase in X results in a 3.2 unit increase in Y.
A 1 unit increase in X results in a 3.2 unit decrease in Y.
28
Multiple Choice
If x is temperature and y is coffee sales, use the following formula to determine the coffee sales on a 34° day.
y = -60x+6443
$4403
$4673
$8483
$6443
29
Multiple Choice
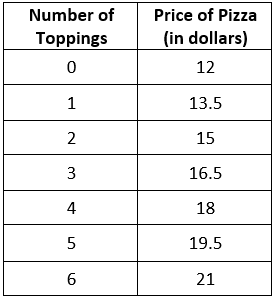
A restaurant sells pizza for the prices in the data table. Calculate the linear regression equation of the data.
y = 1.5x + 12
y = 12x + 1.5
y = 0.67x - 8
y = -8x + 0.67
30
Multiple Choice
31
Multiple Choice
A survey found that 39% of the population owned dogs, 22% owned cats, and 8% of the population owned both a cat and a dog? Find the probability that a person owns a cat or a dog.
0.08
0.53
0.61
0.36
32
Multiple Choice

P(Pizza|Senior):
1/2
4/5
2/3
1/5
33
Multiple Choice

What is the probability that the person picked will be a boy given they speak German?
8/11
2/5
4/25
3/11
34
Multiple Choice
When would you expect the experimental probability of an event to get closer to equaling the theoretical probability of the event?
When there are exactly 50 trials in the experiment.
The fewer the number of trials in the experiment.
The larger the number of trials in the experiment.
This can't be determined.
35
Multiple Choice
40% of students in a school wore blue on a Spirit Day. If two students are randomly selected, what is the probability that both students will not be wearing blue?
0.16
0.36
0.24
0.60
36
Unit One: Descriptive Statistics and Graphs
Modules 1-3
37
Main Ideas
Experiment vs Observational Study
Two Way Tables
SOCS (Shape Outlier Center Spread)
Identify categorical/numerical variables
Graphs of categorical/numerical variables
Descriptive Statistics
38
Multiple Choice
The city of Smyrna wants to know which brand of paint will last longer. They paint 2 streets with brand A and two streets with brand B and checked which lasted longer. Is this a survey, observational study or an experiment?
Survey
Observational Study
Experiment
39
Multiple Choice
At a local high school, GPA's are normally distributed with a mean of 2.9 and standard deviation of 0.6. Using th Empirical Rule, what percentage of students at the high school have a GPA between 2.3 and 3.5?
68%
99.7%
95%
84%
40
Multiple Choice
In a factory, the weight of the concrete poured into a mold by a machine follows a normal distribution with a mean of 1150 pounds and a standard deviation of 22 pounds. Approximately 95% of molds filled by this machine will hold weights in what interval?
1084 to 1216 pounds
1106 to 1150 pounds
1106 to 1194 pounds
1128 to 1172 pounds
41
Multiple Choice

The data in the picture:
is left skewed
is right skewed
symmetrical
42
Multiple Choice
The mean annual automobile insurance premium is RM950, with a standard deviation of RM175. Find the z-score that corresponds to a premium of RM1250.
A. 1.13
B. -1.13
C. 1.71
D. -1.71
43
Multiple Choice
The heights (in inches) of a sample of basketball players are shown:
76 79 81 78 82 78
Find the standard deviation.
A. 2.2
B. 6
C. 2
D. 4.8
44
Multiple Choice

Estimate the frequency of the class with the greatest frequency.
A. 28
B. 21
C. 58
D. 53
45
Multiple Choice

46
Multiple Choice
23, 34, 27, 7, 30, 26, 28, 31, 34
47
Multiple Choice

What percent of students have a height between 58 inches and 60 inches?
25%
50%
75%
100%
48
Multiple Choice

TCC STA2023 Final Exam Review
K Washington
Show answer
Auto Play
Slide 1 / 48
SLIDE
Similar Resources on Wayground

43 questions
121_Week 6_Story 5_The Frightened Rabbit
Presentation
•
University
38 questions
Graphing Linear Inequalities
Presentation
•
KG
44 questions
TEAS Prep Session 4
Presentation
•
University
43 questions
Seminari 4 - Percepció del color i transtorns perceptius 24-25
Presentation
•
University
42 questions
Tecido Cartilaginoso
Presentation
•
University
44 questions
Apps & applications
Presentation
•
Professional Development
43 questions
BBB3013 Noun (N) / Noun Phrase (NP)
Presentation
•
University
44 questions
Quadratics & Polynomials Test Review
Presentation
•
12th Grade
Popular Resources on Wayground
28 questions
US History Regents Review
Quiz
•
11th Grade
36 questions
Biology Regents Review
Quiz
•
9th - 10th Grade
20 questions
Math Review
Quiz
•
3rd Grade
38 questions
Regents Life Science General Review
Quiz
•
9th Grade
20 questions
Math Review
Quiz
•
6th Grade
21 questions
EOY Grade 6 Benchmark Assessment - Content Skills
Quiz
•
6th Grade
20 questions
Inferences
Quiz
•
4th Grade
20 questions
Figurative Language Review
Quiz
•
6th Grade