Search Header Logo
12/14: 8th Math Semester Review

12/14: 8th Math Semester Review

Assessment

Presentation

Mathematics

8th Grade

Practice Problem

Hard

CCSS
8.F.B.4, 8.F.A.1, 8.EE.B.5

+31

Standards-aligned

Created by

Jaye Sanford

Used 35+ times

FREE Resource

6 Slides • 43 Questions

1

12/14: 8th Math Fall Semester Review

COVID 2020

Slide image

2

Real Number Relationships

  • 8.2(D)   order a set of real numbers arising from mathematical and real-world contexts

Slide image

3

Multiple Choice

Which of the following shows a list of values in decreasing order?

1

6.007, 2π, 48-6.007,\ -2\pi,\ -\sqrt{48}

2

2π, 48, 6.007-2\pi,\ -\sqrt{48},\ -6.007

3

2π, 6.007, 48-2\pi,\ -6.007,\ -\sqrt{48}

4

6.007, 48, 2π-6.007,\ -\sqrt{48},\ -2\pi

4

Multiple Choice

The list below shows a set of numbers in order from least to greatest:

 5 125, 5.1,     , 2.425\ \frac{1}{25},\ 5.1,\ \ \ \ \ ,\ 2.4^2  

Which of the following could be the missing value? 

1

 26\sqrt{26}  

2

 29\sqrt{29}  

3

 35\sqrt{35}  

4

 40\sqrt{40}  

5

Multiple Choice

List the following numbers from least to greatest:

-64 , 3.5 , √27 , 6.666...

1

-64 , 3.5 , √27 , 6.666...

2

3.5 , √27 , 6.666..., -64

3

3.5, -64, √27, 6.666...

4

6.666, √27, -64, 3.5

6

Multiple Choice

Question image

Which list below show the shapes in order from greatest area to least area?

1

F Object A, Object C, Object B

2

G Object C, Object B, Object A

3

H Object B, Object A, Object C

4

J Object A, Object B, Object C

7

Multiple Choice

Question image

1

F

2

G

3

H

4

J

8

Multiple Choice

Question image
1

A

2

B

3

C

4

D

9

Rate of Change, Unit Rate & Slope

  • 8.4(B)   graph proportional relationships, interpreting the unit rate as the slope of the line that models the relationship

  • 8.4(C)   use data from a table or graph to determine the rate of change or slope and y-intercept in mathematical and real-world problems

Slide image

10

Multiple Choice

Question image

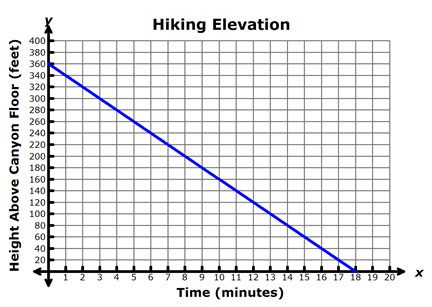
What does the y intercept mean on this graph?

1

It took the hiker 18 minutes to reach the bottom.

2

It took the hiker 360 minutes to reach the bottom.

3

The hiker started out at a height of 360 feet.

4

The hiker started out at a height of 18 feet.

11

Multiple Choice

Question image

What is the y intercept of this graph?

1

(6,2)

2

(-2,0)

3

(2,6)

4

(0,3)

12

Multiple Choice

Question image

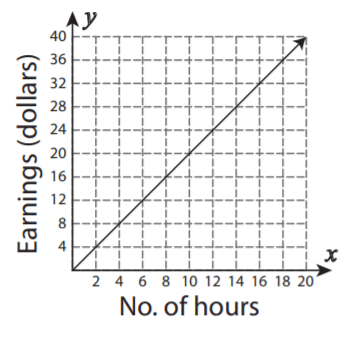
How much money does Rico earn each hour of doing chores?

1

2

2

4

3

6

4

8

13

Multiple Choice

Question image

1

F

2

G

3

H

4

J

14

Multiple Choice

Question image

Robin went to an amusement park on her vacation. The table below shows the cost of her amusement park visit. What statement is true? (HINT: cost per ride is the slope and admission cost is the y-intercept)

1

The cost per ride is $5.50

2

The cost per ride is $3.50

3

The cost of admission is $5.

4

The cost of admission is $3.

15

Multiple Choice

Question image
Does this graph represent a proportional relationship?  
1
No, because it doesn't pass through the origin.
2
Yes, because it doesn't pass through the origin.
3
Yes, because it intersects the y axis.
4
No, because it intersects the x axis.

16

Multiple Choice

Which of the following equations represents a proportional relationship.
1
y = 4x + 7
2
y = -2.5x - 3
3
y = 19x + 0
4
y = 27x - 4

17

Multiple Choice

Question image

TEKS: 8.4B On a field trip, there are 3 adults for every 45 students. Which graph models a relationship with the same unit rate?

1

F

2

G

3

H

4

J

18

Multiple Choice

Question image

TEKS: 8.4B An aquarium is being filled with water. The graph shows the height of the water over time as the aquarium is being filled. Which statement best describes the rate of change for this situation?

1

The height of the water increases 20 inches per second

2

The height of the water increases 1 inch per second

3

The height of the water increases 5 inches per second

4

The height of the water increases 2.5 inches per second

19

Multiple Choice

Question image

TEKS: 8.4B Judy can decorate 3 cakes in 5 hours. Which graph has a slope that best represents the number of cakes per hour Judy can decorate?

1

A

2

B

3

C

4

D

20

Multiple Representations & Functions

  • 8.5(I) write an equation in the form = mx + b to model a linear relationship between two quantities using words, equations, tables, & graphs

  • 8.5(G)  identify functions using sets of ordered pairs, tables, mappings, and graphs  

Slide image

21

Multiple Choice

Question image

Which representation does NOT show y as a function of x? (HINT: Which is NOT a function...think x repeats)

1

A

2

B

3

C

4

D

22

Multiple Choice

Question image

Which statement describes the mapping?

1

The mapping represent y as a function of x, because each y-value corresponds to exactly one x-value.

2

The mapping does not represent y as a function of x, because two of the x-values correspond to the same y-value.

3

The mapping represent y as a function of x, because each x-value corresponds to exactly one y-value.

4

The mapping does not represent y as a function of x, because there are more x-values than different corresponding y-values.

23

Multiple Choice

Question image

Which set of ordered pairs represents y as a function of x?

1

A

2

B

3

C

4

D

24

Multiple Choice

Question image

Which set of ordered pairs represents y as a function of x?

1

A

2

B

3

C

4

D

25

Multiple Choice

Question image

Which graph does NOT represent y as a function of x?

1

A

2

B

3

C

4

D

26

Multiple Choice

Question image

Which representation shows y as a function of x?

1

A

2

B

3

c

4

D

27

Multiple Choice

Question image
Write the slope-intercept form of the equation of a line using the given graph.
1
A
2
B
3
C
4
D

28

Multiple Choice

Question image
1

A/F

2

B/G

3

C/H

4

D/J

29

Multiple Choice

Question image

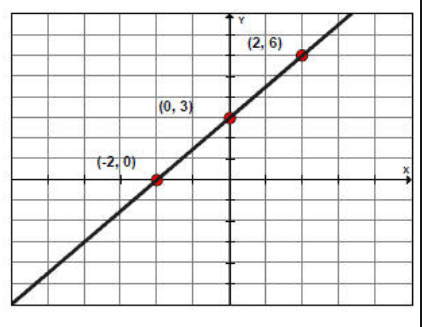
Which equation can be used to describe the relationship between x and y shown in the graph?

1

y = 3x + 2

2

y = -3x - 6

3

y = 3x - 6

4

y = -3x + 2

30

Multiple Choice

Question image
1

A/F

2

B/G

3

C/H

4

D/J

31

Multiple Choice

Question image
1

A/F

2

B/G

3

C/H

4

D/J

32

Multiple Choice

Question image

A company sells bottles of vitamin capsules. The graph and table show the linear relationship between the cost per capsule in cents and the number of bottles ordered.


What is the slope of the line that models this situation?

1

-5

2

5

3

15

4

-15

33

Equations & Inequalities

  • 8.8(C)   model and solve one-variable equations with variables on both sides of the equal sign that represent mathematical and real-world problems  

  • 8.8(A)   write one-variable equations or inequalities with variables on both sides that represent problems

Slide image

34

Multiple Choice

Solve for x:


5x - 14 = 8x + 4

1

x = 6

2

x = -6

3

x = -18/13

4

x = 10/3

35

Multiple Choice

Joe asked for prices on two different gym memberships.


· One gym charges an initial fee of $30 and a monthly fee of $10.

· The other gym charges a monthly fee of $12.


Which equation could be used to find out how many months, m, it would take for both memberships to cost the same?

1

A. 12m + 30 = 10m + 30

2

B. 10m + 30 = 12m

3

C. 10m = 12m

4

12m + 30 = 10m

36

Multiple Choice

Ace Plumbing Service charges $35 per hour plus a $25 travel charge for a service call. Good Guys Plumbing Repair charges $40 per hour for a service call with no travel charge. How long must a service call be for the two companies to charge the same amount?

1

5

2

125

3

3

4

75

37

Multiple Choice

What value of x makes this equation true?

 0.5x2=0.2x+70.5x-2=0.2x+7  

1

3

2

30

3

16

4

10

38

Multiple Choice

What is the value of x that makes this equation true?

 4x+5=x+144x+5=x+14  

1

2

2

9

3

3

4

4

39

Multiple Choice

In Ms. Johnson’s class a student will get 3 points for having their name on their paper and 4 points for each question that is correct. In Mr. Gallegos class, a student will get 7 points for having their name on their paper and 2 points for each question correct. Which inequality could be used to determine x, the number of questions that would give you a higher grade in Ms. Johnson’s class?

1

4x + 3 7 + 2x4x\ +\ 3\ \ge\ 7\ +\ 2x

2

4x + 3 > 7 + 2x4x\ +\ 3\ >\ 7\ +\ 2x

3

4x + 3 7 + 2x4x\ +\ 3\ \le\ 7\ +\ 2x

4

4x + 3 < 7 + 2x4x\ +\ 3\ \ <\ 7\ +\ 2x

40

Multiple Choice

Question image

The equation is modeled below.


5w + 3 = 4w + 9


What value of w makes this equation true?

1

3

2

6

3

12

4

8

41

Represent & Interpret Data

  • 8.11(A) construct a scatterplot and describe the observed data

  • 8.5(D)   use a trend line that approximates the linear relationship to make predictions

  • 8.11(B) determine the mean absolute deviation

Slide image

42

Multiple Choice

What is the first step when calculating the Mean Absolute Deviation?
1
Find the distance each value is from the mean
2
Find the mean of the distances
3
Find the mean of the data

43

Multiple Choice

Question image

What is the mean absolute deviation for this set of data? (HINT: "mean of the mean" -> 1. find the mean, 2. find the difference between the mean and each data point, 3. find the mean of the differences)

1

71

2

24

3

4

4

13

44

Multiple Choice

Question image

The scatter plot shows the relationship between the number of chapters and the total number of pages for several books. Use the trend line to predict how many chapters would be in a book with 180 pages.

1

12 chapters

2

15 chapters

3

18 chapters

4

21 chapters

45

Multiple Choice

Question image
If the debate team plans to practice for 6 hours, how many debates should they win?
1
20
2
16
3
24
4
28

46

Multiple Choice

Question image
Which scatter plot shows a linear relationship between x and y?
1
Graph A
2
Graph B
3
Graph C
4
Graph D

47

Multiple Choice

Question image
What type of association does this graph have?
1
positive
2
negative
3
none
4
all of the above

48

Poll

Check the topic(s) that you feel confident about as you prepare for your semester exam.

Real Number Relationships

Rate of Change, Unit Rate and Slope

Multiple Representations & Functions

Equations & Inequalities

Represent & Interpret Data

49

Poll

Since you made it to the end of the review today, please let me know how you would like to review in Zoom tomorrow.

Quizizz live game using the same questions (a few less)

Kahoot class game

Select the 10-12 most missed review questions and discuss how to solve them

Calculator Tips for Exam

Team Quizizz in breakout rooms

12/14: 8th Math Fall Semester Review

COVID 2020

Slide image

Show answer

Auto Play

Slide 1 / 49

SLIDE