Search Header Logo
  1. Resource Library
  2. Math
  3. Geometry
  4. ...
  5. Course 2 Translations Lesson
Course 2 - Translations Lesson

Course 2 - Translations Lesson

Assessment

Presentation

Mathematics

7th Grade

Easy

CCSS
8.G.A.3, HSF.IF.B.4, 6.EE.B.5

+3

Standards-aligned

Created by

NANCY HEAGERTY

Used 32+ times

FREE Resource

3 Slides • 6 Questions

1

​Warm-Up

2

Math Response

A school principal wants to place a gift card inside two randomly selected 7th grade student’s locker from those shown. What is the probability of the first student’s locker having a number that is a multiple of 3, then without replaceing that locker in the choices getting a locker with an odd number?

Type answer here
Deg°
Rad

3

Multiple Choice

Question image
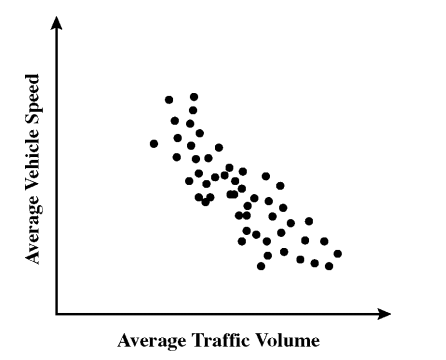
This scatter plot shows the average traffic volume and average vehicle speed on a certain freeway for 50 days in 1999.  Which statement best describes this relationship.
1
As traffic volume increases, vehicle speed increases.
2
As traffic volume increases, vehicle speed decreases.
3
As traffic volume increases, vehicle speed increases at first, then decreases.
4
As traffic volume increases, vehicle speed decreases at first, then increases.

4

Math Response

Solve:
-8(x - 3) - 4x < 108
Type answer here
Deg°
Rad

5

media

6

media

7

Open Ended

Question image

8

Fill in the Blank

Type answer...

9

Multiple Choice

Question image

1

A

2

B

3

C

​Warm-Up

Show answer

Auto Play

Slide 1 / 9

SLIDE