Search Header Logo
  1. Resource Library
  2. Math
  3. Probability And Statistics
  4. Line Of Best Fit
  5. Correlation And Line Of Best Fit Notes
Correlation and Line of Best Fit Notes

Correlation and Line of Best Fit Notes

Assessment

Presentation

Mathematics

9th Grade

Easy

CCSS
HSS.ID.B.5, HSS.ID.C.8, 8.EE.B.5

Standards-aligned

Created by

Alexandria Lopez

Used 17+ times

FREE Resource

1 Slide • 18 Questions

1

Line of Best Fit

Correlation

Skew of a Graph

Slide image

2

Multiple Choice

The correlation coefficient is a number "r" such that:

1

-1<r<1

2

-1>r>1

3

-1≤r≤1

4

-1≥r≤1

3

Multiple Choice

Question image

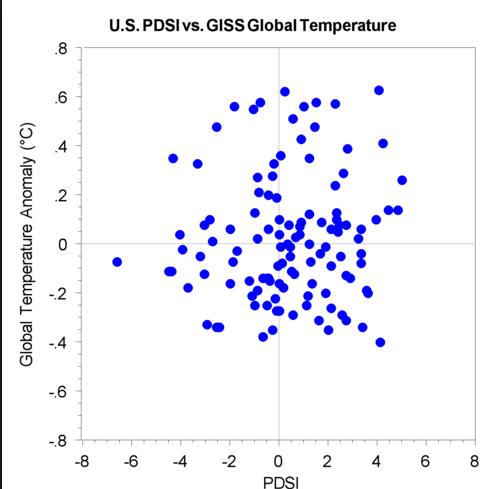
What type of association does this scatter plot represent?

1

positive linear association

2

negative linear association

3

no association

4

nonlinear association

4

Multiple Choice

Question image

Describe the correlation in the graph shown.

1

Strong Negative

2

Strong Positive

3

Weak Negative

4

Weak Positive

5

Multiple Choice

Question image
What is the type of correlation?
1
Negative 
2
no correlation
3
positive 

6

Multiple Choice

Question image

What type of correlation does this scatter plot show?

1

positive

2

negative

3

no correlation

4

nonlinear association

7

Multiple Choice

Question image

Estimate the correlation coefficient for this scatterplot.

1

r = 1.2

2

r = 0.89

3

r = 0

4

r = -0.89

8

Multiple Choice

Question image

Estimate the correlation coefficient for this scatterplot.

1

r = -0.9

2

r = 1

3

r = 0.9

4

r = -1

9

Multiple Choice

r=-0.89

1

Strong positive

2

Weak positive

3

Strong negative

4

Weak negative

10

Multiple Choice

r=0.3

1

Strong positive

2

Weak positive

3

Strong negative

4

Weak negative

11

Multiple Choice

Question image

Determine the Correlation Coefficient and decide whether it is weak, moderate, or strong.

1

0.80 weak

2

0.90 moderate

3

0.80 strong

4

0.90 strong

12

Multiple Choice

Question image

Determine the Correlation Coefficient and decide whether it is weak, moderate, or strong.

1

0.07 weak

2

-0.26 weak

3

-0.26 moderate

4

0.07 strong

13

Multiple Choice

Question image

How would you describe this distribution?

1

Left skewed

2

Uniform

3

Right Skewed

4

Symmetrical

14

Multiple Choice

Question image

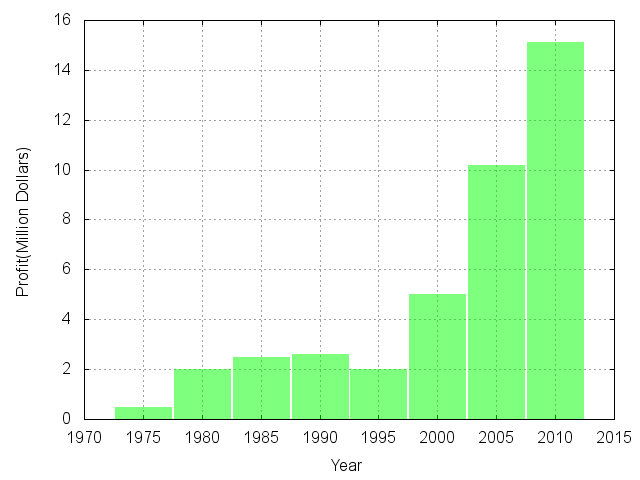
What is the shape of this bar graph?

1

Skew right

2

Skew left

3

Symmetrical

4

uniform

15

Multiple Choice

Question image

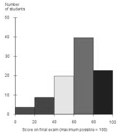
Describe the histogram:

1

Left Skewed

2

Normal/Symmetrical

3

Right Skewed

4

Uniform/Flat

16

Multiple Choice

Question image

Describe the shape of the graph.

1

Skewed right

2

Skewed left

3

Uniform

4

Symmetrical

17

Multiple Choice

Question image

Shape?

1

Skewed right

2

Skewed left

3

Symmetric

4

Normal

18

Multiple Choice

Question image

The table shown is comparing a person's foot length to their height in cm. Calculate a line of best fit.

1

f(x) = 25.05x + 5.57

2

f(x) = 5.57x + 25.05

3

f(x) = -5.57x + 25.05

4

f(x) = 5.57x - 25.05

19

Multiple Choice

find line of best fit using calculator through these points (0,0)(1,2) (3,5) (6,7)

1

y=65x+7

2

y=1.14x+.64

3

y=1.5x+64

Line of Best Fit

Correlation

Skew of a Graph

Slide image

Show answer

Auto Play

Slide 1 / 19

SLIDE