Search Header Logo
  1. Resource Library
  2. Math
  3. Data And Graphing
  4. Trimester 2 Math Test: Data And Graphing
Trimester 2 MATH Test: Data and Graphing

Trimester 2 MATH Test: Data and Graphing

Assessment

Presentation

Mathematics

1st - 4th Grade

Medium

CCSS
1.MD.C.4, 2.MD.D.10, 2.MD.D.9

+15

Standards-aligned

Created by

Test Carr

Used 3+ times

FREE Resource

3 Slides • 32 Questions

1

Trimester 2 MATH Test: Data and Graphing

Slide image

2

Slide image

3

Multiple Choice

The best way to organize data is in an __________ .

1

ORGANIZED WAY

2

UN-Organized WAY

4

Multiple Choice

Question image

Which sport had the most votes?

1

Football

2

Basketball

3

Volleyball

4

Rugby

5

Tennis

5

Multiple Choice

What is a Pie Graph?

1

A graph that uses pictures of pie to display data.

2

A graph that uses bars to display data

3

A graph that is shaped like a circle to display data

6

Multiple Choice

Question image

What Superhero got the least amout of votes?

1

Superman

2

Thor

3

The Hulk

4

Iron Man

7

Multiple Choice

Question image

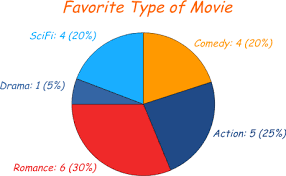
What type of graph is shown?

1

pictograph

2

stem and leaf

3

pie chart

4

histogram

8

Multiple Choice

Question image

What is the title of this graph?

1

Cookie Sales

2

Number of boxes

3

day

4

Cookie sales and number of boxes

9

Multiple Choice

Question image

What kind of graph is this?

1

Color

2

Bar

3

Line

4

Pie

10

Multiple Choice

Question image

Which cereal received the least amount of votes?

1

Corn Flakes

2

Cheerios

3

Life

4

Kix

11

Multiple Choice

Question image

How many push ups were done on Friday?

1

0

2

20

3

5

4

10

12

Multiple Choice

Question image

How many kids wore walking shoes to school today?

1

7

2

10

3

9

4

6

13

Multiple Choice

Question image
How many students take the bus to school?
1
35
2
20
3
10
4
15

14

Multiple Choice

Question image
How many people voted for red as their favorite color?
1
100
2
2
3
4
4
9

15

Multiple Choice

Question image
BONUS!!! How many children like purple and blue all together?
1
2
2
9
3
12
4
4

16

Multiple Choice

Question image

What type of graph is this?

1

Bar Graph

2

Pictograph

3

Line Plot

4

Tally Chart

17

Multiple Choice

A ______ shows data using pictures.

1

Pictograph

2

Bar graph

3

Line graph

4

Tally Chart

18

Multiple Choice

Question image

How many people voted in all?

1

9

2

1

3

13

19

Multiple Choice

Question image

Which picnic supply was used the least?

1
2
3

20

Multiple Choice

Question image

Which picnic supply was used the most?

1
2
3

21

YOUR DOING GREAT!

KEEP IT UP :) -MS. CARR

22

Multiple Choice

Question image
How many people liked Mickey Mouse best?
1
4
2
10
3
5
4
6

23

Multiple Choice

Question image
How many children like green?
1
100
2
10
3
2
4
5

24

Multiple Choice

Question image

How many people voted altogether?

1

18 people

2

19 people

3

20 people

4

21 people

25

Multiple Choice

Question image

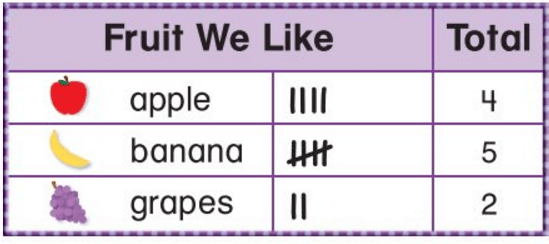
Which fruit did most children choose?

1

apple

2

banana

3

grapes

26

Multiple Choice

Question image

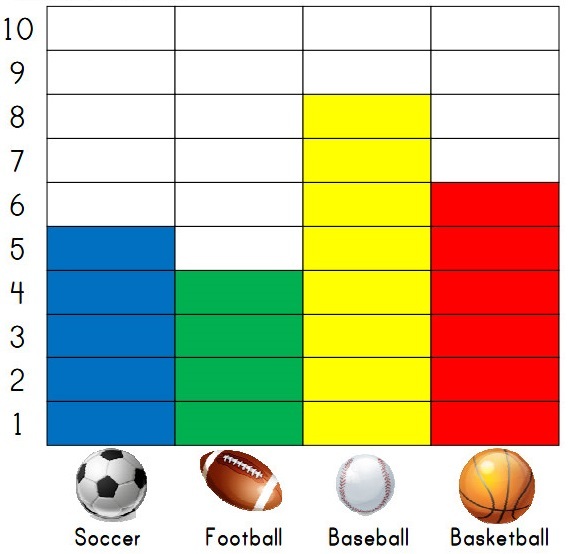
How many more people like baseball than soccer?

1

9

2

3

3

13

4

2

27

Multiple Choice

Question image

How many people like soccer best?

1

5

2

4

3

8

4

6

28

Multiple Choice

Question image

What type of graph is this?

1

bar graph

2

pictograph

3

tally chart

29

Multiple Choice

Question image

What is this type of Graph called?

1

Bar Graph

2

Horizontal Graph

3

Vertical Graph

4

Pictograph

30

Multiple Choice

Question image

How many kids like Blue ?

1

4

2

5

3

6

4

1

31

Multiple Choice

Question image

What snack do the kids like the least ?

1

Vegetables

2

Popcorn

3

Trail Mix

4

Crackers

32

Multiple Choice

Question image

What 2 colors are equal ?

1

Red and Blue

2

Pink and Yellow

3

Green and Yellow

4

Green and Red

33

Multiple Choice

Question image

What is the most favorite color ?

1

Green

2

Red

3

Pink

4

Black

34

Multiple Choice

Data is _____

1

Something you color.

2

Not real.

3

Information shown on a graph.

4

Things that are YOUR favorite.

35

Multiple Choice

What is a bar graph?

1

A graph with a circle.

2

A graph that uses bars to show amounts. The taller the bar, the more it stands for.

3

Something you find in a library.

4

A silly picture.

Trimester 2 MATH Test: Data and Graphing

Slide image

Show answer

Auto Play

Slide 1 / 35

SLIDE