
Scatter Plots: Outliers and Clusters
Presentation
•
Mathematics
•
8th Grade
•
Easy
+4
Standards-aligned

Michael Phillips
Used 73+ times
FREE Resource
8 Slides • 30 Questions
1
Scatter Plots: Outliers and Clusters

2
3
Outlier #1
Notice how the point at (30, 6000) is an outlier and does not fit with the data

4
Not an Outlier
This is NOT an Outlier because it falls on the TREND LINE or Line of BEST FIT.
Note: the line of best fit is a line that goes through the middle of the points

5
6
Multiple Select
7
Multiple Select

What data points are outliers in the scatter plot?
8
Multiple Choice

Is there an outlier in this data set?
9
Multiple Choice
10
Multiple Choice

Is the point in red an outlier?
11
CLUSTERS
A Cluster is data that is group or packed tightly together
Think of a huddle in a football game or a group of friends near one locker
Clusters should be identified by their domain and range or x and y values
Notice the clusters at certain ages

12
Multiple Choice
13
Multiple Choice
14
Multiple Select
15
Multiple Choice

Which best describes the data in the table?
16
Multiple Choice

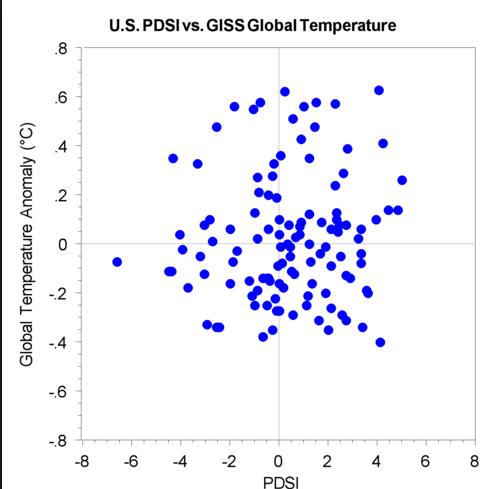
This graph has...
17
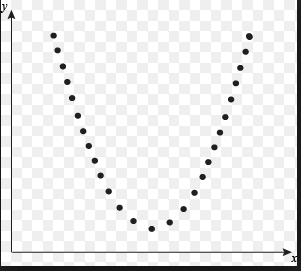
Linear Association vs Non-Linear
Linear - The data shows a line or forms a line
Non-Linear - the data does not form a line

18
Multiple Choice

19
Multiple Choice
20
Multiple Choice

21
Multiple Choice
22
Multiple Choice
23
Multiple Choice
24
Multiple Choice

25
Multiple Choice

26
Multiple Choice

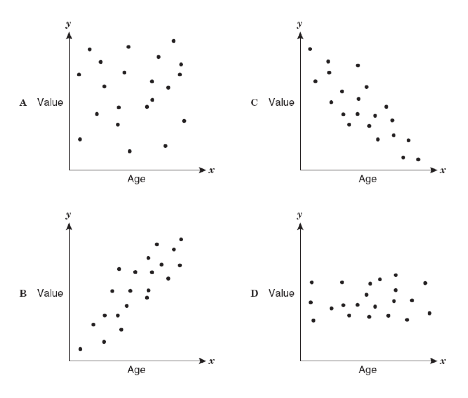
What type of correlation does graph C have?
27
Multiple Choice

What type of correlation does this graph have?
28
Multiple Choice
What type of correlation does this graph have?
29
A GAP
A Gap is when data fits the trend line or line of best fit but has a gap of time or data in between
Notice the Gap in the graph

30
Multiple Choice

Which game did 500 people attend?
31
Multiple Choice
Did more people attend game 2 or game 3?
32
Multiple Choice

Identify any clusters.
33
Multiple Choice

Identify any gaps.
34
Multiple Choice

Identify any outliers.
35
Multiple Choice

Identify any outliers, gaps, or clusters.
36
Multiple Choice

Identify any gaps.
37
Multiple Choice

Describe the relationship between the data.
38
Multiple Choice
Describe the relationship between the data.
Scatter Plots: Outliers and Clusters
Show answer
Auto Play
Slide 1 / 38
SLIDE
