
Interpreting Distance Time Graphs
Presentation
•
Science
•
7th Grade
•
Practice Problem
•
Medium
Standards-aligned
Used 618+ times
FREE Resource
9 Slides • 15 Questions
1
Interpreting Distance Time Graphs

2
3

4
When you analyze the graph, you will notice that Edward stopped from 10 to 11:30 am

5
6
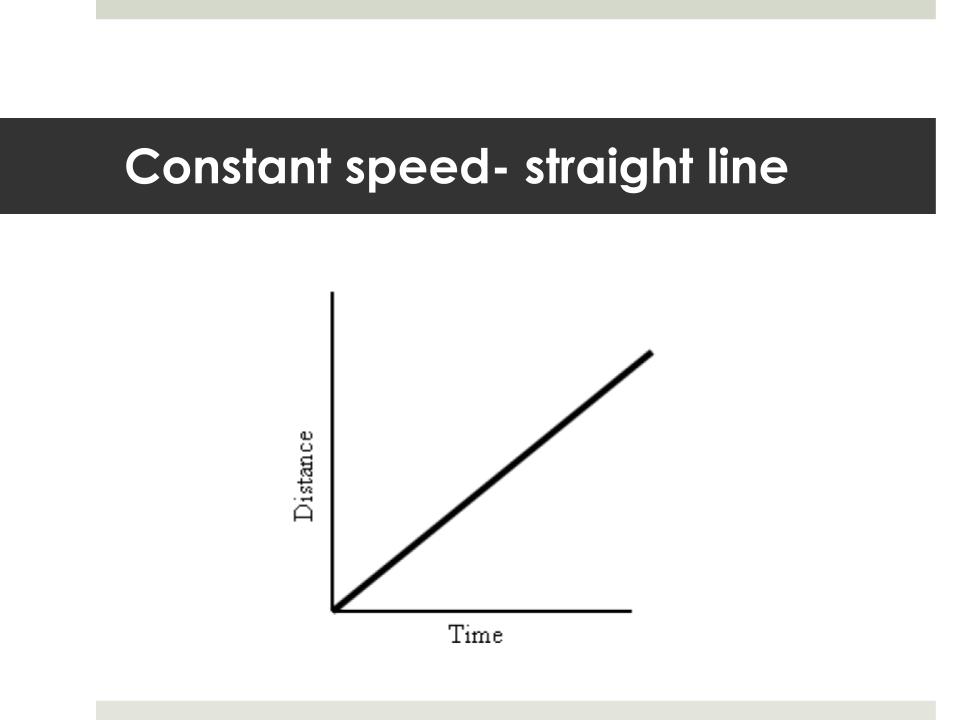
When you analyze the graph, you will notice that the object traveled at a constant speed between points A and B

7

8
When you analyze the graph, you will notice that Leroy's path was faster than the other two runners.

9
10
Multiple Choice

The car is stopped in scenario -
11
Multiple Choice
The car is traveling at constant speed in scenario-
12
Multiple Choice
The car is coming back in scenario-.
13
Multiple Choice

How far was Edward from home when he visited Nicola?
14
Multiple Choice
HOW LONG DID EDWARD STOP FOR?
15
Multiple Choice
WHAT WAS EDWARD'S AVERAGE SPEED? (HINT: IT TOOK EDWARD 5 HOURS TO GET TO HIS DESTINATION)
***Remember to use the formula
AVERAGE SPEED = TOTAL DISTANCE/TOTAL TIME
16
Multiple Choice

How far from Bristol is Anne at 08:00?
17
Fill in the Blanks
Type answer...
18
Multiple Choice
Calculate Anneʼs speed for the first two hours of her journey
19
Multiple Choice

How far does the cyclist travel between A and B?
20
Multiple Choice
How long does it take the cyclist to cover 800 meter distance?
21
Multiple Choice
Describe the motion from points b to c
22
Multiple Choice
Calculate the cyclist’s average speed between b and c
23
Multiple Choice
Calculate the cyclist’s average speed between A and D
24
Poll
Interpreting Distance Time Graphs
Show answer
Auto Play
Slide 1 / 24
SLIDE
