
Speed Time Graphs
Presentation
•
Science
•
6th - 7th Grade
•
Medium
•
NGSS
MS-PS3-1, MS-PS2-1, MS-PS2-2
Standards-aligned
Used 729+ times
FREE Resource
10 Slides • 6 Questions
1
Speed Time Graphs

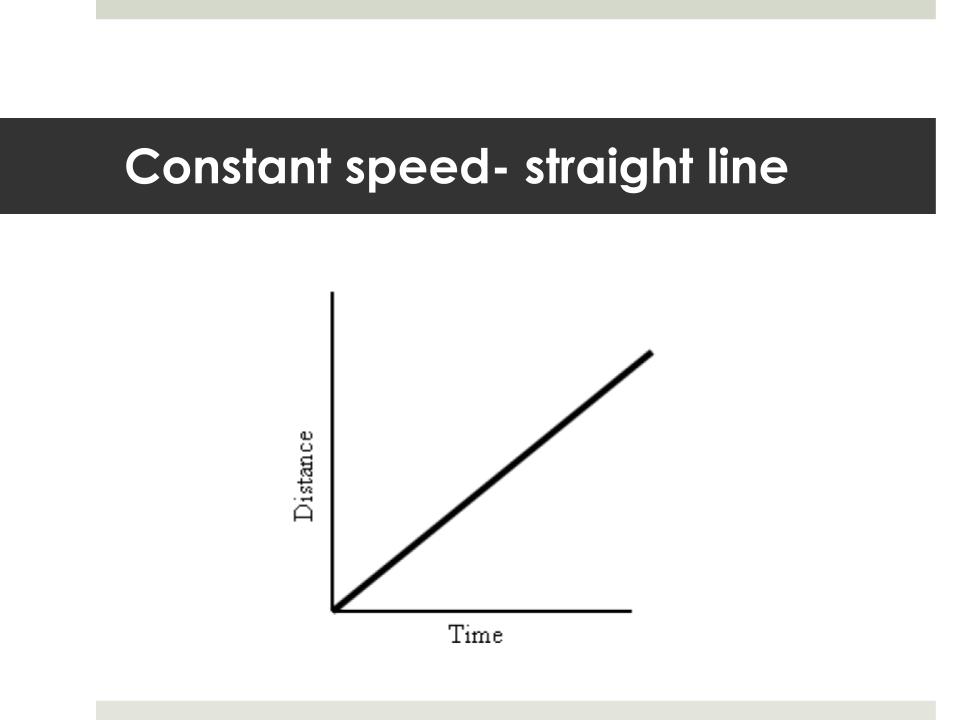
2
3
4

5
6

7
In a Speed(velocity) Time graph you will find Speed on the Y axis and time on the x axis

8

9

10
11
Multiple Choice

12
Multiple Choice

13
Multiple Choice

14
Multiple Choice

The car is stopped in scenario -
15
Multiple Choice
The car is traveling at constant speed in scenario-
16
Multiple Choice
The car is coming back in scenario-.
Speed Time Graphs
Show answer
Auto Play
Slide 1 / 16
SLIDE
