
Jay_July 31_Understanding Graphs
Presentation
•
Mathematics
•
6th - 7th Grade
•
Easy
+9
Standards-aligned

Steven Rachel
Used 2+ times
FREE Resource
12 Slides • 11 Questions
1
Jay_July 31_Understanding Graphs

2
3
Bar Graph
(Definition)

4
Bar Chart
Suppose I interviewed a group of your friends at school and asked them what their favorite movie was. I recorded the information in the table shown on the right.

5
Bar Chart
You could display the information in a bar chart

6
7
2020 Cowboys Receiving STATS
Elliot (338 yards)
Pollard (193 yards)
Prescott (11 yards)
Lamb (993 yards)
Cooper (1114 yards)
Schultz (615 yards)
Gallup (843 yards)

8
Improper Scaling
Poor scaling can mislead observers of the graph. Sometimes groups (especially news), will scale the graph in a way to make you feel a certain away (ELICIT AN EMOTIONAL RESPONSE)

9
Open Ended
10
A better way
Proper scaling helps you tell the truth!!!
Improper scaling deceives people who read your graph!

11
Adjusting the window
You can also adjust the window minimum and maximum values to view the information in a different way.

12
Open Ended

Tell me what you notice about this graph ?
13
Multiple Choice
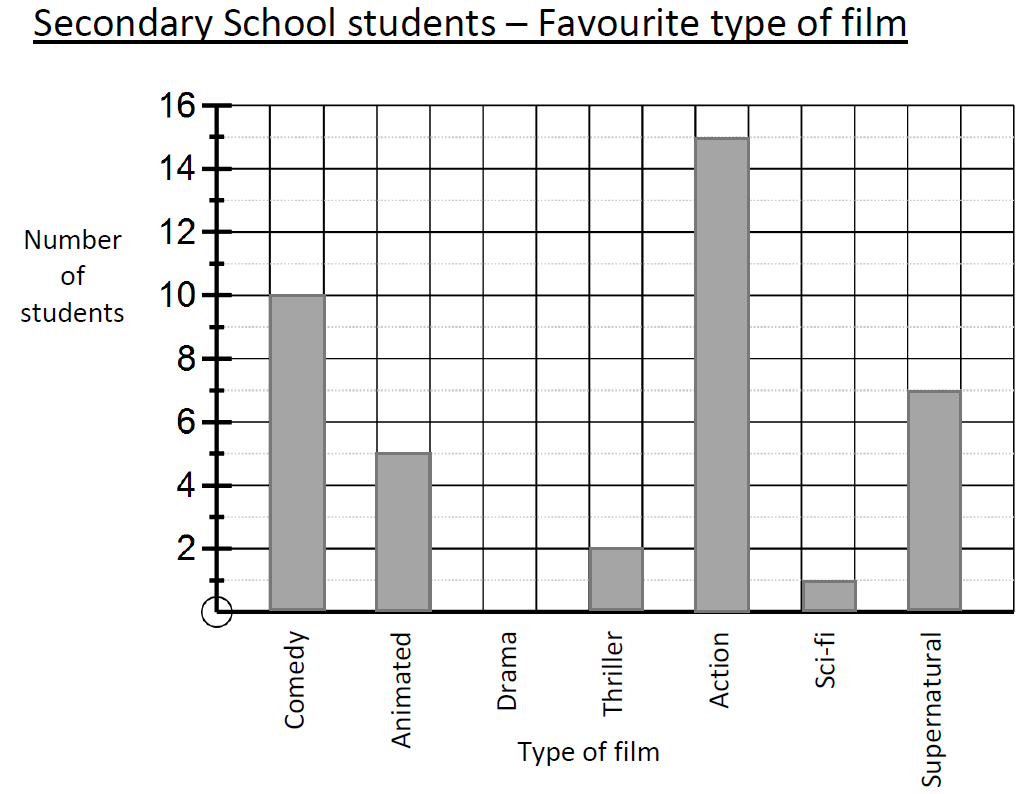
How many more people said Action than Supernatural as their favourite type of film?
14
Multiple Choice
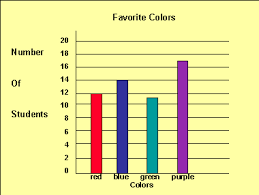
How many more people have purple for a favourite colour than red?
15
Multiple Choice
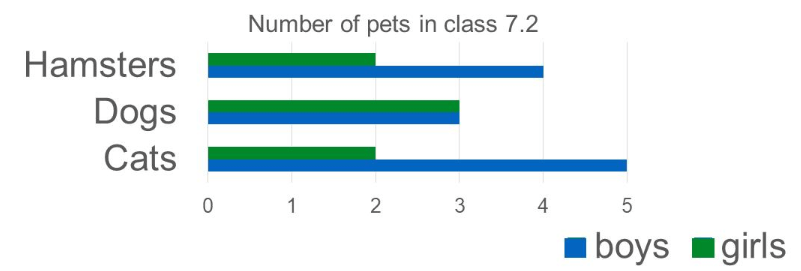
From the bar chart, how many pets do the girls in the class have?
16
Multiple Choice
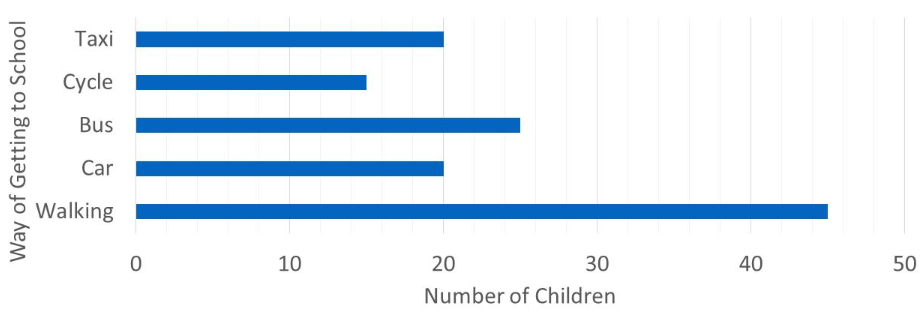
How many more children walk than take a taxi to school?
17
Circle Graphs
Circle graphs, sometimes referred to as a pie chart compare categories within relation to a whole.

18
19
Multiple Choice

The pie chart shows the colours of 32 beads. How many green beads are there?
20
Multiple Choice

The pie chart shows the hair colour of a Year 9 class. A student is selected at random. What is the probability that they have brown hair?
21
Multiple Choice

These pie charts show how people travel to work in 2 towns. In which town do more people travel to work by bike?
22
Multiple Choice

This pie chart shows the colour of hats that Tim owns. What fraction of Tim's hats are blue?
23
Multiple Choice

This pie chart shows the colour of hats that Tom owns. Which colour hat does he own the second most of?
Jay_July 31_Understanding Graphs
Show answer
Auto Play
Slide 1 / 23
SLIDE
