
Motion Graphs
Presentation
•
Science
•
9th Grade
•
Medium
Standards-aligned

B Taylor
Used 139+ times
FREE Resource
14 Slides • 20 Questions
1
2
3
4

5

6
Multiple Choice
7
Multiple Choice

On this position vs time graph, describe the motion of A.
8
Multiple Choice
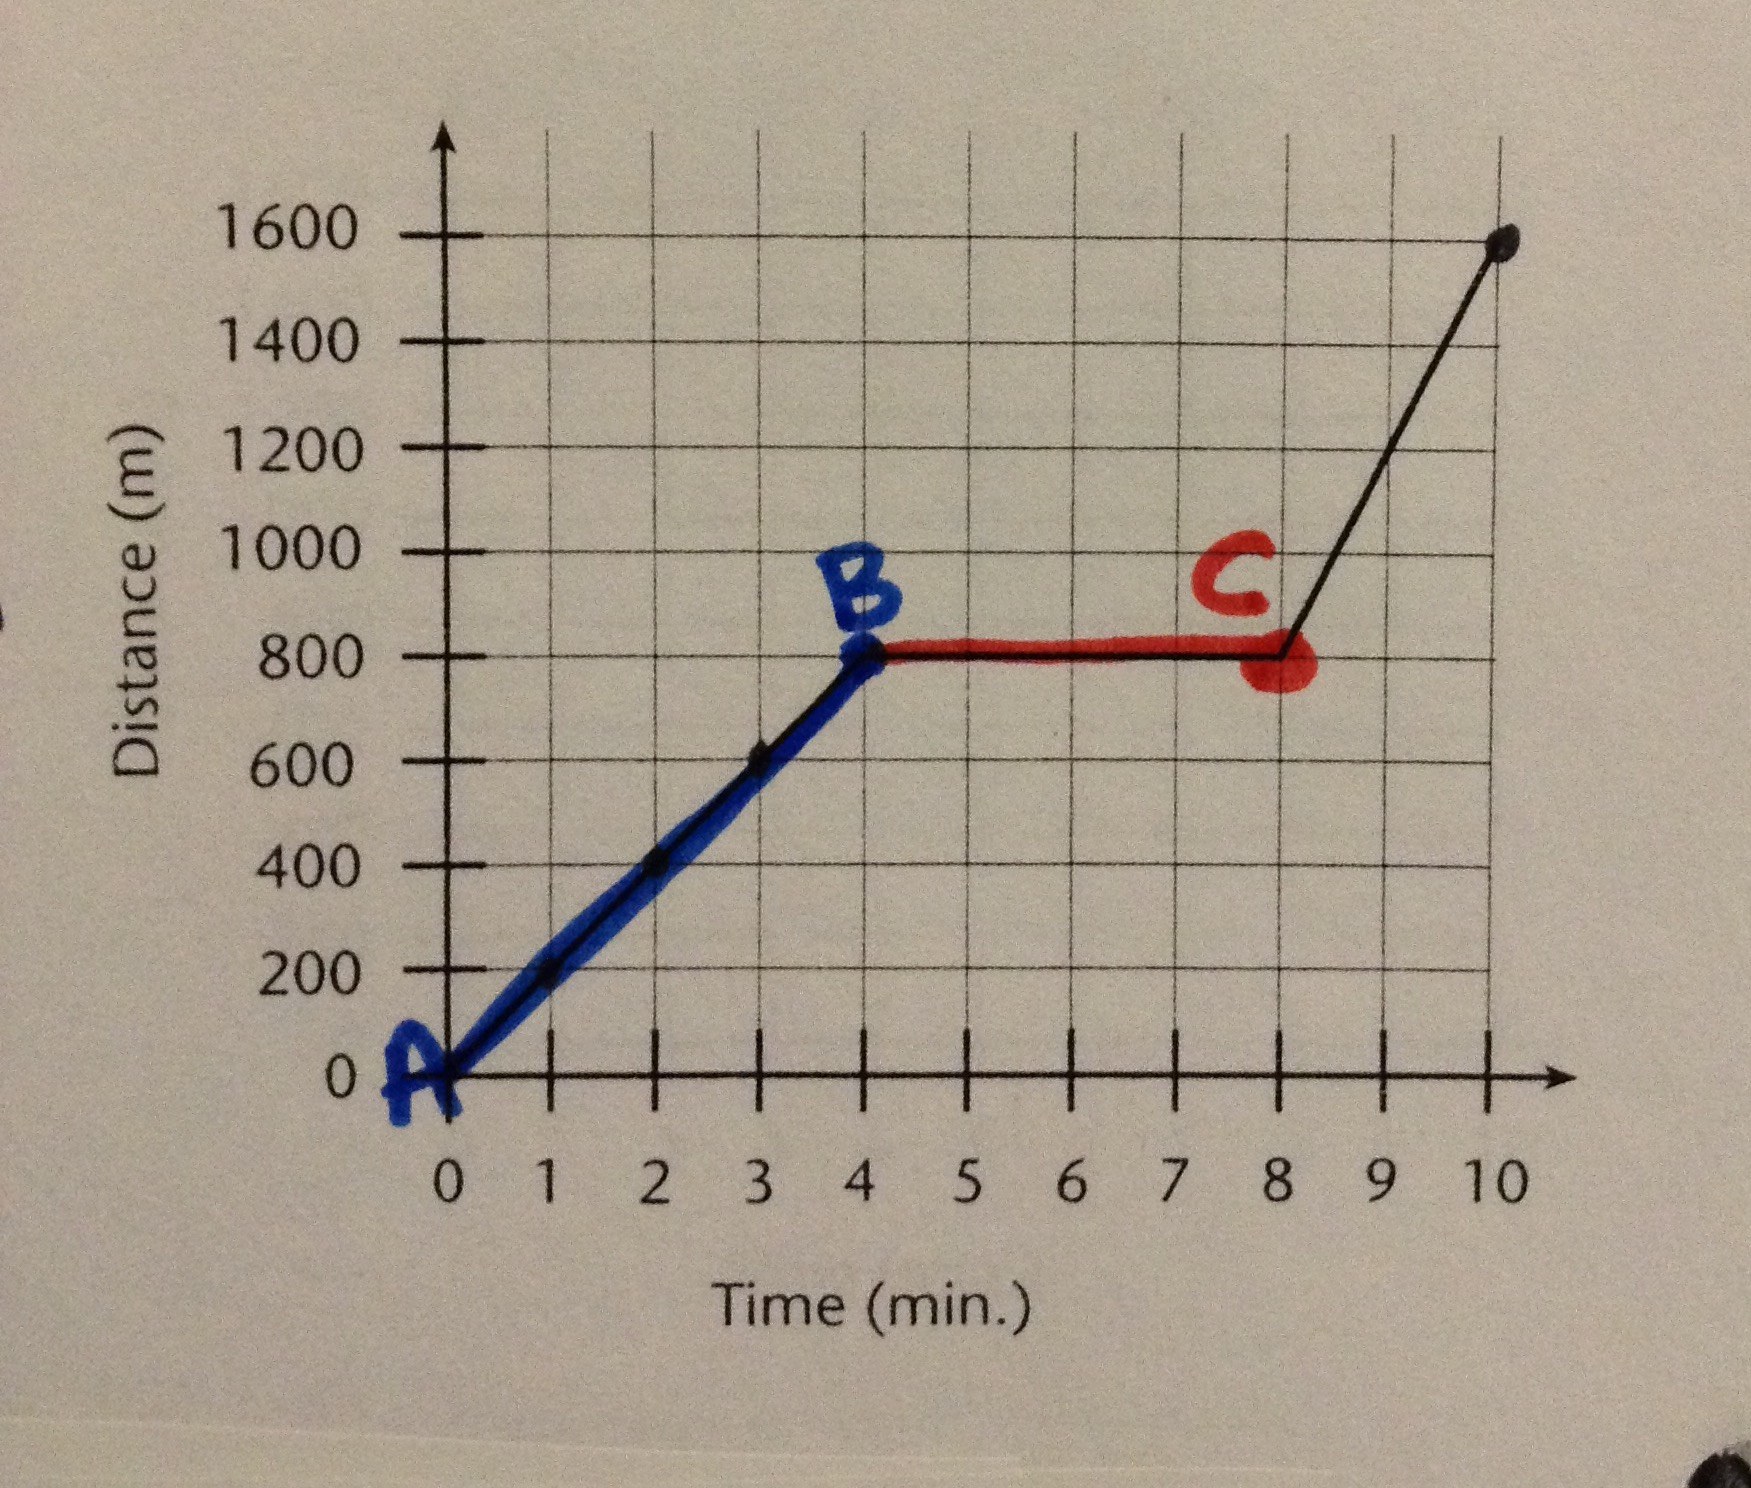
What is occurring from point A to point B?
9

10
Multiple Choice

11

12
Multiple Choice
13
Multiple Choice

14

15
Multiple Choice
16
Multiple Choice

17
Multiple Choice

18

19
Multiple Choice

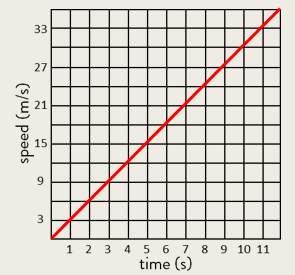
On this position vs time graph, what is the velocity?
20
Multiple Choice

21
Multiple Choice

Anne cycles from Bristol to Salisbury.
The diagram shows the distance-time graph of her journey.
What is Anne's speed for the first two hours of her journey?
22

23

24

25

26


27
Multiple Choice

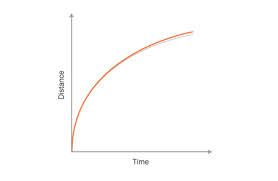
What is this graph showing?
28
Multiple Choice

What is this graph showing?
29
Multiple Choice

What is this graph showing?
30
Multiple Choice
31
Multiple Choice
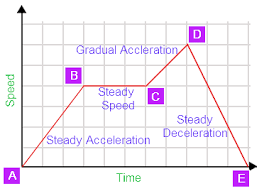
At what point is the speed the greatest?
32
Multiple Choice
33
Multiple Choice

34
Multiple Choice
Show answer
Auto Play
Slide 1 / 34
SLIDE
