Search Header Logo
F4 Mathematics Statistics Lesson

F4 Mathematics Statistics Lesson

Assessment

Presentation

Mathematics

9th - 10th Grade

Hard

Created by

Karla Williamson

Used 9+ times

FREE Resource

78 Slides • 43 Questions

1

media

F4 Mathematics

Statistics

by Karla Williamson

2

media
media

​means

3

​Objectives

Differentiate between types of data [discrete and continuous variables; ungrouped and grouped data]

2. Construct a frequency table for a given set of data [ungrouped and grouped data]

3. Determine class features for a given set of data [class interval, boundaries, limits, midpoint, width]

4. Construct statistical diagrams [pie charts, bar charts, line graphs, histograms and frequency polygons]

5. Interpret statistical diagrams

6. Determine measures of central tendency for raw, ungrouped and grouped data [mean, median and mode]

7. Determine whether it is most appropriate to use the mean, median and mode as the average for a set of data

4

​What is Statistics?

Statistics is concerned with the collection, organization, presentation and interpretation of data.

media
media

5

Classifications of Data​

6

​What is Data?

Data are observations (measurements) of some quantity or quality of something in the world. Conclusions can then be drawn from the data collected.

Most followed instragram accounts in 2019:

  1. ​Christiano Renaldo

  2. ​Ariana Grande

  3. ​Salena Gomez

media
media

7

media

8

media

9

media

10

media
media

11

12

13

media

14

Multiple Choice

Question image
Your teacher has asked you to explain the difference between quantitative and qualitative observations. Which statement is correct?
1
Quantitative observations use numbers, qualitative uses the senses.
2
Quantitative observations use the senses, qualitative uses numbers.
3
Quantitative observations use measurement, qualitative uses numbers.
4
Quantitative observations use colors, qualitative uses the senses.

15

Multiple Choice

Question image

I use rulers, scales and calculators to make these observations.

1

qualitative data

2

quantitative data

16

Multiple Choice

Question image

The flower is 8 cm tall.

1

qualitative data

2

quantitative data

17

Multiple Choice

Question image

The center of the flower is yellow and fuzzy.

1

qualitative data

2

quantitative data

18

Multiple Choice

Question image

The flower has 25 petals.

1

qualtitative data

2

quantitative data

19

Multiple Choice

Question image

The rose has three leaves.

1

qualitative data

2

quantitative data

20

Multiple Choice

Question image

The petals are smooth and silky.

1

qualitative data

2

quantitative data

21

Multiple Choice

The leaves on the plant are turning brown.
1
Qualitative
2
Quantitative
3
Both
4
Neither

22

Multiple Choice

The plant has grown 4 cm since yesterday.
1
Qualitative
2
Quantitative
3
Both
4
Neither

23

Multiple Choice

The number of orange Skittles in a bag. 
1
Discrete
2
Continuous

24

Multiple Choice

Joe is losing an average of .5 pounds a week.  Is this continuous or discrete data?
1
Discrete
2
Continuous

25

Multiple Choice

The time it takes for a light bulb to burn out. 
1
Discrete
2
Continuous

26

Multiple Choice

Identify whether the experiment involves a discrete or a continuous random variable.


Recording the number of points scored by a NBA team in each game of the 2018 season

1

Discrete Random Variable

2

Continuous Random Variable

27

Multiple Choice

Identify whether the experiment involves a discrete or a continuous random variable.


Measuring the distance travelled by different cars using 1-liter of gasoline

1

Discrete Random Variable

2

Continuous Random Variable

28

​Class work/Homework

Classifications of Data​

Volume 1

pg 369/370

Ex. 8f

Questions 11 - 20

media

29

Collection of Data​

30

​What is Statistics?

Statistics is concerned with the collection, organization, presentation and interpretation of data.

media

31

​Collection of Data

There are various methods which may be used to collect data.

The method used for collecting data will depend on the type of information required.

​Can you think of any? Have you ever been part of data collection? Is data collection always done with approval?

media

32

Methods of Data Collection

  • Observation

  • Experiments

  • Interviews – face to face and telephone

  • Surveys

  • Questionnaire

media
media
media

33

Multiple Select

Question image

How are you feeling today?

1

I am fine.

2

I am angry.

3

I am sad.

4

I am happy.

34

Poll

Question image

Which is your favourite?

KFC

Church's

Popeye's

Royal Castle

35

Multiple Select

I am good at math.

1

Agree

2

Disagree

3

I'm not sure.

36

Multiple Select

Math is confusing.

1

Agree

2

Disagree

3

I'm not sure.

37

Multiple Select

I don't think math is fun, but I want to get good grades in it.

1

Agree

2

Disagree

3

I'm not sure.

38

Multiple Select

I get tired of working with numbers.

1

Agree

2

Disagree

3

I'm not sure.

39

Multiple Select

Math is boring.

1

Agree

2

Disagree

3

I'm not sure.

40

Multiple Select

I like to do math "in my head."

1

Agree

2

Disagree

3

I'm not sure.

41

Multiple Select

I enjoy math problems when I know how to do them.

1

Agree

2

Disagree

3

I'm not sure.

42

Multiple Select

Math is my favorite subject.

1

Agree

2

Disagree

3

I'm not sure.

43

Organisation of Data​

44

​Organisation of Data

Once the data has been collected, it has to be organised in a way which will make it easy to use.  

One method which is used to organise data is called a

frequency table.

media

45

​Frequency Table

Frequency refers to the number of times an event or a value occurs. 

A frequency table is a table that lists items and shows the number of times the items occur.

media
media

46

Frequency tables and tally marks

Tally marks help in counting the frequency of occurrence of something. It is used for record keeping. 

media
media

47

media

48

​Class work/Homework

Frequency tables and Tally Charts

Volume 1

pg 371/372 Ex. 8g

Questions 1 & 4

Prepare the Tally Chart and Frequency Table

media

49

Multiple Choice

Question image
What type of graph is this?
1
bar graph
2
pictograph
3
tally chart

50

Multiple Choice

How do you group tally marks together?
1
by ones
2
by twos
3
by threes
4
by fives

51

Multiple Choice

Question image
How many tally marks?
1
10
2
15
3
3
4
13

52

Multiple Choice

Question image
How many tally marks?
1
9
2
6
3
3
4
7

53

Multiple Choice

Question image
Choose the sentence that describes the data in the tally chart.
1
Pizza had 10 votes.
2
Pizza got the most votes

54

Multiple Choice

Question image
How many fewer children chose science than math?
1
2 children
2
4 children
3
5 children

55

Multiple Choice

Question image
How many fewer people chose grasshopper than bumblebee?
1
1
2
2
3
3

56

​Marked Assignment

  • ​Think about 4 types of data which you can collect from the Form 4 student population.

  • ​Your data must be qualitative or quantitative - discrete. DO NOT USE CONTINUOUS DATA.

  • ​Determine the best method to collect your data (Google forms, WhatsApp etc).

  • ​Select 15 persons to answer your questions.

  • ​Present the information you collected in a frequency table.

  • Include a tally column in your table.

media

57

Presentation of Data​

58

​Presentation of Data

​The data, once collected and organized can be presented in various forms.  The form used must be relevant to the survey being conducted so as to be effective to the users. 

  • Pictographs

  • ​Bar graphs

  • Line graphs

  • Pie charts

    Histograms

  • Frequency Polygons

media

59

media

​Pictographs

​A pictograph is a pictorial symbol for a word or phrase

60

61

62

​Class work/Homework

Bar Graph

​Page 360 Ex. 8b #3 & 4

​Page 362 Ex. 8c #3 & 4

media

63

64

​Class work/Homework

Line Graph

​Page 367/368

Ex. 8e #1 & 2

media

65

66

67

​Class work/Homework

Pie Chart

​Page 365

Ex. 8e #2, 1, 3b

media

68

Multiple Choice

Question image
What type of graph is this?
1
bar graph
2
pictograph
3
tally chart

69

Multiple Choice

Question image

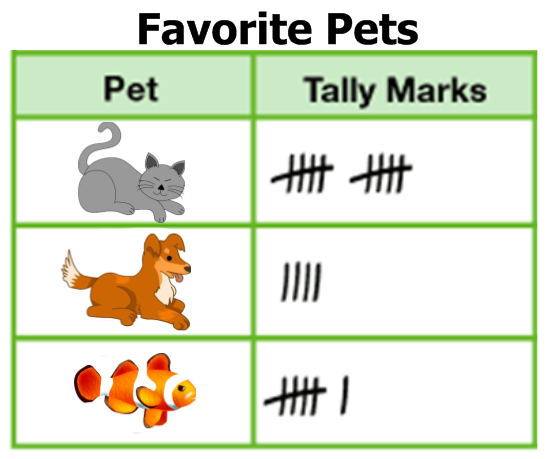
The class took a vote to see what shape everyone liked best. What number of students liked the star shape best?

1

8

2

2

3

5

4

7

70

Multiple Choice

Question image

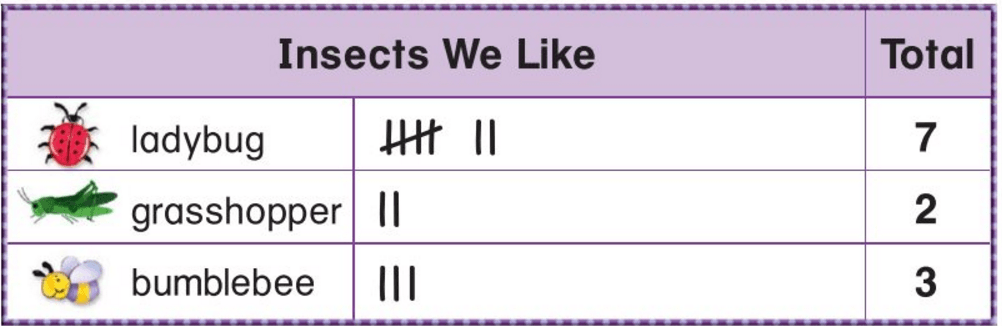
The class took a vote to see how each student gets to school. What number of students rides a bus to school?

1

6

2

9

3

8

4

5

71

Multiple Choice

Question image

See the pictograph to answer the question.

How many guava trees are there in the farm?

1

10

2

40

3

60

4

50

72

Multiple Choice

Question image

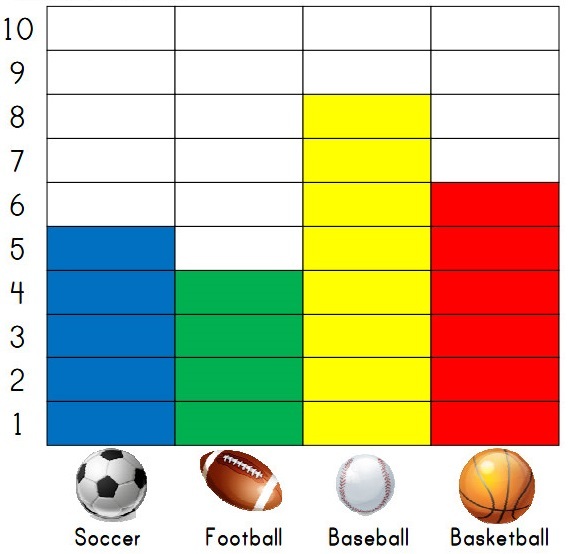
A restaurant recorded the number of pizzas sold each month for one year. The data are shown in the graph below. During which month did the restaurant sell 40 pizzas?

1

March

2

May

3

July

4

August

73

Multiple Choice

Question image

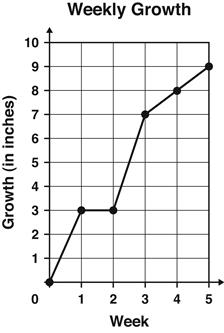
The graph shows the number of inches a plant grew each week.

Between which 2 weeks did the plant grow the MOST?

1

Week 1 and Week 2

2

Week 2 and Week 3

3

Week 3 and Week 4

4

Week 4 and Week 5

74

Multiple Choice

The X axis is _______?
1
vertical
2
diagonal
3
criss-cross
4
horizontal

75

Multiple Choice

The Y axis is _______?
1
Vertical
2
Horizontal
3
criss-cross
4
diagonal

76

Multiple Choice

25% of a circle is equal to:

1

one-fifth

2

a quarter

3

a half

4

two fifth

77

Multiple Choice

Question image

The pie chart shows the colours of 32 beads. How many green beads are there?

1

90

2

8

3

11

4

9

78

Multiple Choice

Question image
There are 200 vegetable plants in a garden.  How many of the vegetable plants are green beans?
1
16
2
24
3
28
4
32

79

Multiple Choice

Question image

600 people were surveyed. How many people rode the stationary bikes that day?

1

150 people

2

120 people

3

90 people

4

None of these

80

​Interpretation/Analysis of Data

81

​Analysis of Data

After data has been collected and presented in a diagram, it must then be analysed to determine what the information really shows.  Analysis of data is a process of inspecting data with the goal of highlighting useful information. 

Sometimes there is a need to find or use a single value which represents the group or set of data as a whole.  This single value is called a statistical average or a measure of central tendency.

82

Measures of Central Tendency

​Central tendency is defined as “the statistical measure that identifies a single value as representative of an entire distribution.” It aims to provide an accurate description of the entire data. It is the single value that is most typical/representative of the collected data.

For example,

  • If a football team’s average score is 5.2 goals, we know that the team is good at scoring goals.

  • If two classes have average ages of 8.7 and 16.9 years, we expect that the first is a Primary School class and the second is a Secondary School class.

The mean, median and mode are the three commonly used measures of central tendency.

83

The three measures of central tendency are:

Mean Median Mode

The method used to calculate the mean and the median depends on the type of data.  We will learn how to calculate these from three types of data:

(1) Raw

(2) Ungrouped

(3) Grouped

​Measures of Central Tendency

84

Mean, Median, Mode​

Raw Data​

85

​Raw Data

​Raw data is the data that is collected from a source, but in its initial state. It has not yet been processed — or cleaned, organized, and visually presented. It is data which has not been sorted in any way. 

E.g. marks obtained by 8 students in an exam:   95, 83, 75, 52, 71, 68, 75, 49.

media
media

86

87

​Class work/Homework

Mean from Raw Data

​Page 390 Ex. 8m #1 - 4, 13 - 15

​Median from Raw Data

​Page 393 Ex. 8n #1 - 5

​Mode from Raw Data

​Page 395 Ex. 8o #1 - 4

media

88

Mean, Median, Mode​

Ungrouped Data​

89

​Ungrouped vs Grouped Data

Ungrouped data is data that has been ordered in some way according to item. 

The table on the left shows ungrouped data. The table on the right shows grouped data.

THIS SECTION FOCUSES ON UNGROUPED DATA.

media
media

90

Mode - Ungrouped Data

In an ungrouped frequency distribution, the value of the item having maximum frequency is taken as the mode.

media

​The modal colour is green.

91

​Class work

Mode from Ungrouped Data

Page 395

Ex. 80 #5 - 7

media

92

​Mean - Ungrouped Data

​The mean of a frequency distribution with ungrouped data can be calculated by using a formula.

​See page 388 in the Volume 1.

media
media

93

94

​Class work/Homework

Mean from Ungrouped Data

​Volume 1, ​Page 390

​Ex. 8m

​#9 - 12

media

95

Median - Ungrouped Data

  1. Construct a cumulative frequency table (also called a running total).

  2. Find the position of the median  -  ½ (n + 1)th rank.

  3. Find the data value which corresponds with the position of the median.

media

96

97

​Class work/Homework

Median from Ungrouped Data

​Volume 1, ​Page 393

​Ex. 8n

​#6(a), 7(a), 8(a), 9, 10

media

98

Mean, Median, Mode​

Grouped Data​

99

Grouped Data

​Large quantities of data can be much more easily viewed and managed if placed in groups in a frequency table.

Grouped data does not enable exact values for the mean, median and mode to be calculated. Alternate methods of analysing the data have to be employed.

Grouped data is data that has been clustered according to classes.

100

media

​This table shows the data, mass (kg), organised in groups, 41 - 49, 50 - 58, etc. There are 5 groups.

101

​Grouped Data

You need to know the following about grouped data:

  • Each group is called a class.

  • The size of the group is called the class interval.

  • The end numbers of each group are called the class limits.

  • The first number in each group is called the lower class limit and the last number, the upper class limit.

  • ​Each class has boundaries, a lower boundary and an upper boundary.

  • Width of class interval = upper class boundary – lower class boundary

    The midpoint of each class interval = ½ (upper limit + lower limit)

media
media

102

103

media

104

media

105

​Class work/Homework

Modal Class from Grouped Data

​Volume 2, ​Page 886

​Ex. 15c

​#1(a), 2(a), 3(b), 4(a), 5(a), 6(a)

media

106

​Mean from Grouped Data

​The mean of a frequency distribution of grouped data can be estimated by taking the midpoint of each class interval to represent that particular group or class.

​The same formula is used as with ungrouped data, but the x values are the midpoints and not the data values.

Let's look at the formula and then a video.

107

media

108

109

110

​Class work/Homework

Mean from Grouped Data

​Volume 2, ​Page 871

​Ex. 15a

​#1 - 12

media

111

​Median from Grouped Data

​To estimate the median of a set of grouped data a cumulative frequency curve or ogive is drawn.

​In drawing a cumulative frequency curve we plot values less than the upper class boundary against the cumulative frequency.

112

media

113

​Class work/Homework

Median from Grouped Data

​Volume 2, ​Page 871

​Ex. 15a

​#1 - 12

media

114

Histogram​

115

​What is a Histogram?

​A frequency distribution shows how often each different value in a set of data occurs.

A histogram is the most commonly used graph to show frequency distributions. It looks very much like a bar chart, but there are important differences between them.

116

media

117

118

media

119

​Class work/Homework

Histograms

​Volume 2, ​Page 871

​Ex. 15a

​#1 - 12

media

120

Frequency Polygons​

121

​Class work/Homework

Histograms

​Volume 2, ​Page 871

​Ex. 15a

​#1 - 12

media
media

F4 Mathematics

Statistics

by Karla Williamson

Show answer

Auto Play

Slide 1 / 121

SLIDE