

7.11A- LINEAR RELATIONSHIPS
Presentation
•
Mathematics
•
6th - 7th Grade
•
Medium
+9
Standards-aligned
Sade Chambers
Used 10+ times
FREE Resource
15 Slides • 20 Questions
1
7.11A
By Sade Chambers
2
3
4
Number your paper from 1-4. Write each equation, and IDENTIFY the slope (m) and the y-intercept (b).
5
6 TYPES OF REPRESENTATIONS
PICTURES
TABLES
GRAPHS
EQUATIONS
VERBAL/ STORY PROBLEMS
NUMBERIC
6
Multiple Choice
Craig earns extra money as a lifeguard. He earns $37 for 4 hours and $64.75 for 7 hours. What is the constant of proportionality?
$37
$64.75
$9.25
$18.50
7
8
9
Multiple Choice
In the equation y = 14x, what is the constant of proportionality?
y
x
14
1/14
10
Multiple Choice
Identify the Slope from the given equation.
y = 5x - 2
2
-2
5
-5
11
Multiple Choice
Find the rate of change
1
2
11
Not a constant slope/Non-Linear
12
Multiple Choice
Identify the Y- intercept from the given equation.
y = -2x - 6
-2
-6
2
6
13
ANSWER THE QUESTION IN YOUR JOURNAL. ALL 4 ANSWERS ARE ON THIS SLIDE AND THE NEXT.
14
ANSWER THE QUESTION IN YOUR JOURNAL. ALL 4 ANSWERS ARE ON THIS SLIDE AND THE NEXT.
15
16
Multiple Choice
Frank and his family drove 6 hours every day during a road trip. Which graph best represents y, the total number of hours driver in x days?
17
18
Multiple Choice
A scooter can travel 100 miles in 4 hours. Which graph best represents y, the number of miles the scooter can travel in x hours at this rate?
19
8
9
10
11
20
21
Multiple Choice
What is the constant of proportionality?
8
16
24
2
22
Multiple Choice
F
G
H
J
23
24
Multiple Choice
A dolphin travels through the water of a speed of 25 kilometers per hour. Which representation shows the distance a dolphin can travel at this rate? (7.4A)
25
Multiple Choice
A blue wildebeest travels at a speed of 42 kilometers per hour. Which representation shows the distance a wildebeest can travel at this rate?
26
Multiple Choice
The graph represents the linear relationship between the number of books Layla has read and the number of months she has been a member of a book club. (7.4A)
Layla has read 2 books in the first 3 months she was a member of the book club.
Layla has read 3 books in the first 2 months she was a member of the book club.
Layla has read 3 books in the first 4 months she was a member of the book club.
Layla has read 4 books in the first 3 months she was a member of the book club.
27
28
Multiple Choice
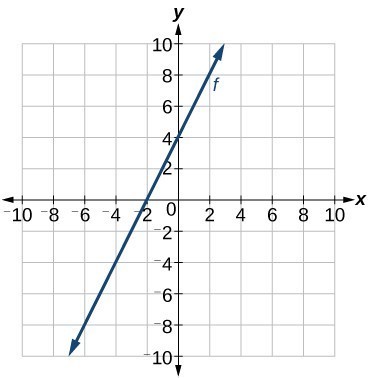
Which equation best represents the relationship between x and y in the graph? (7.7A)
y = 2x + 4
y = 2x - 2
y = 1/2x + 4
y = 1/2x - 4
29
Multiple Choice
The table shows the relationship between y, the cost to rent a boat, and x, the amount of time the boat is rented. Which graph best represents the relationship between x and y shown in the table? (7.7A)
30
Multiple Choice
A fish is swimming at a constant rate toward the ocean floor. The equation y = -7x -3 can be used to represent this situation, where y is the depth of the fish in meters below sea level and x is the number of seconds the fish has been swimming.
Which statement best describes the depth of this fish, given this equation? (7.7A)
From a starting position of 7 meters below sea level, the fish is descending 3 meters per second
From a starting position of 7 meters below sea level, the fish is ascending 3 meters per second
From a starting position of 3 meters below sea level, the fish is descending 7 meters per second
From a starting position of 3 meters below sea level, the fish is ascending 7 meters per second
31
Multiple Choice
Cheddar cheese costs $4.25 per pound. Which equation best represents y, the total cost of x pounds of cheddar cheese?
x = 4.25 + y
x = 4.25y
y = 4.25 + x
y = 4.25x
32
Multiple Choice
A
B
C
D
33
Multiple Choice
A
B
C
D
34
Multiple Choice
F
G
H
J
35
Multiple Choice
Which table contains only values that satisfy the equation
y = 0.5x + 14?
7.11A
By Sade Chambers
Show answer
Auto Play
Slide 1 / 35
SLIDE
Similar Resources on Wayground
30 questions
Angle Relationships
Presentation
•
7th Grade
31 questions
Unit Rate/Unit Cost Lesson
Presentation
•
6th Grade
26 questions
Area and Perimeter with Expressions
Presentation
•
7th Grade
26 questions
Circles
Presentation
•
7th Grade
25 questions
Equations of Proportional Relationships
Presentation
•
6th - 8th Grade
28 questions
Graphing Inequalities
Presentation
•
6th - 7th Grade
29 questions
Theoretical and Experimental Probability
Presentation
•
6th - 8th Grade
27 questions
Simple Interest
Presentation
•
7th Grade
Popular Resources on Wayground
10 questions
5.P.1.3 Distance/Time Graphs
Quiz
•
5th Grade
10 questions
Fire Drill
Quiz
•
2nd - 5th Grade
20 questions
Equivalent Fractions
Quiz
•
3rd Grade
22 questions
School Wide Vocab Group 1 Master
Quiz
•
6th - 8th Grade
20 questions
Main Idea and Details
Quiz
•
5th Grade
20 questions
Context Clues
Quiz
•
6th Grade
20 questions
Inferences
Quiz
•
4th Grade
12 questions
What makes Nebraska's government unique?
Quiz
•
4th - 5th Grade
Discover more resources for Mathematics
10 questions
Box Plots
Quiz
•
6th - 7th Grade
14 questions
Volume of rectangular prisms
Quiz
•
7th Grade
22 questions
Simple Probability
Quiz
•
7th Grade
20 questions
Graphing Inequalities on a Number Line
Quiz
•
6th - 9th Grade
20 questions
Box and Whisker Plots
Quiz
•
6th Grade
20 questions
Ratios/Rates and Unit Rates
Quiz
•
6th Grade
15 questions
Distributive Property & Review
Quiz
•
6th Grade
13 questions
Area of Composite Figures
Quiz
•
7th Grade