
Correlations
Presentation
•
Mathematics
•
9th Grade
•
Medium
Standards-aligned

Sara Farley
Used 66+ times
FREE Resource
5 Slides • 16 Questions
1
2

3
Multiple Choice
4
Multiple Choice

5
Multiple Choice

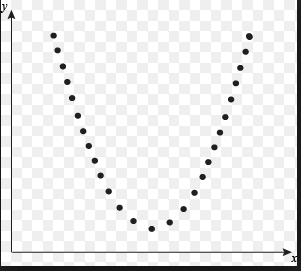
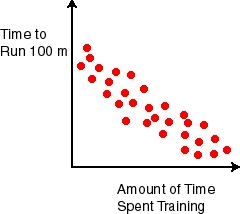
What type of association is represented by the scatter plot
6
Multiple Choice

7
Multiple Choice
8
9
Multiple Choice

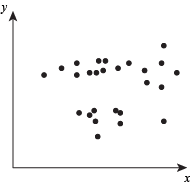
Which best describes the form of this scatterplot?
10
Multiple Choice

11
Multiple Choice
12


13

14
Multiple Choice
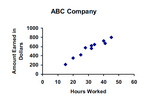
Estimate the correlation coefficient for this scatterplot.
15
Multiple Choice
Estimate the correlation coefficient for this scatterplot.
16
Multiple Choice
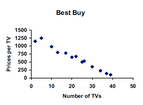
Estimate the correlation coefficient
17
Multiple Choice
18
Multiple Choice
19
Multiple Choice
20
Multiple Choice

Which correlation coefficient (r) best represents the graph?
21
Multiple Choice
Which correlation coefficient (r) best represents the graph?
Show answer
Auto Play
Slide 1 / 21
SLIDE
