Search Header Logo
  1. Resource Library
  2. Math
  3. Probability And Statistics
  4. Regression
  5. Ap Review: Regression
AP Review: Regression

AP Review: Regression

Assessment

Presentation

Mathematics

9th - 12th Grade

Practice Problem

Hard

CCSS
HSS.ID.B.6B, HSS.ID.C.8, HSF.IF.B.4

+2

Standards-aligned

Created by

Monika Christoff

Used 1+ times

FREE Resource

7 Slides • 9 Questions

1

Chapter 3: Regression

2

media
media
media

Positive/Negative or No Association

Direction

Address any points that have high residuals or would be influential points

Unusual Points

Linear vs. Non Linear

Form

Weak, moderate or strong

Strength

media

​CONTEXT

3

Multiple Select

Question image

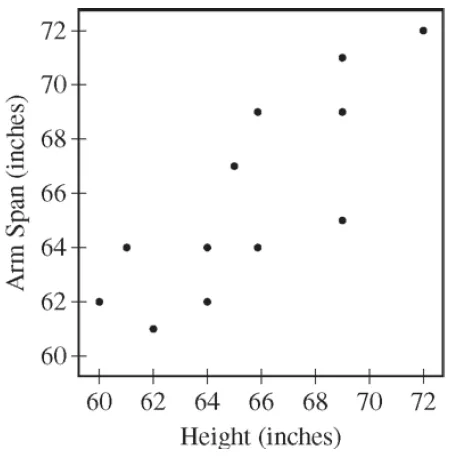
A student measured the height and arm spans, rounded to the nearest inch, of each person in a random sample of 12 seniors at a high school. A scatterplot of arm span vs height for 12 seniors are shown.

Describe the relationship.

1

There is a moderately strong, positive, linear relationship between height and arm span

2

There is a moderately weak, positive, linear relationship between height and arm span

3

There is a moderately strong, positive, non-linear association between hieght and arm span

4

There is a moderately weak, positive, linear association between height and arm span

4

Multiple Choice

Which of the above scatterplots suggests a strong correlation?

1

Plot A indicates a stronger correlation as the linear pattern extends further

2

Plot B indicates a stronger correlation as there is less open space

3

The scatterplots suggest that the correlation is the same

4

Without seeing a computer regression printout, one cannot know which plot suggests a stronger correlation

5

The amount by which the predicted value of y changes when x increases by 1 unit

Slope of regression line

Predicted value of y when x = 0

Y-intercept of regression line

the percent of the variability in the response variable (y ) that is accounted for by the least square regression line

Coefficient of determination (r2)

measures the direction and strength of association for linear relationships only!

Correlation coefficient (r)

Slope of regression line (b1) = r * (sy/sx)

6

media

More facts about correlation

  • ​correlation does not measure form

  • correlation only describes linear relationship

  • correlation does not imply causation

  • correlation is not a resistant measure of strength

  • both variables must be quantative

  • if you switch x and y correlation will stay same

  • you can change units of measurement and correlation will stay same (there are no units of measurement for correlation)

7

Multiple Choice

Question image

A newspaper in Germany reported that the more semesters needed to complete an academic progam at the university, the greater the starting salary in the first year of the job. The number of semesters is the explanatory variable and the starting salary (in 1000 Euros) is the response variable.

The table shows the computer output from a liner regression analysis on the data.

Identify the slope of the least squares regression line and interpret the slope in context.

1

The slope is 34.018 and it represents a change starting salary of 34,018 Euros for every additional one semester.

2

The slope is 1.1594 and it represents a change starting salary of 1,159 Euros for every additional one semester.

3

The slope is 4.455 and it represents a change of 4.45 semesters for every additional one Euro.

4

I and

8

Multiple Choice

Question image

What is the correlation coefficient and interpret it's value.

1

It is 0.335 and it represents 33.5% of the variability in the salary changes were accounted for by the least squares regression line.

2

It is 0.578 and it represents 57.9% of the variability in the salary changes were accounted for by the least squares regression line.

3

It is 0.335 and it represents that the relationship between semesters and salary is a positive and relatively weak linear relationship.

4

It is 0.578 and it represents that the relationship between semesters and salary is a positive and moderate linear relationship.

9

Multiple Choice

The correlation between two scores X and Y equals 0.8. If both the X scores and the Y scores are converted to z-scores, then the correlation between the z-scores for X and the z-scores for Y would be

1

-0.8

2

-0.2

3

0

4

0.8

10

media

The difference between the actual value of y and the value of y predicted by the regression line.

Residual

media

11

Multiple Choice

Question image

Jamal is researching the characteristics of a card that might be useful in predicting the fuel consumption rate (FCR). The length of a car is one explanatory variable that can be used to predict FCR. A computer output from a linear regression is shown. For a point that represents one car length of 175 inches and an FCR of 5.88. Calculate and interpret the residual for the car relative to the least squares regression line.

1

4.92

The actual FCR is 4.92 gallons/100 miles greater than the predicted value.

2

0.96

The actual FCR is 0.96 gallons/100 miles greater than the predicted value.

3

-0.96

The actual FCR is 0.96 gallons/100 miles less than the predicted value.

4

-4.92

The actual FCR is 0.96 gallons/100 miles greater than the predicted value.

12

Points that have much larger or much smaller x values than the other points in the data set

High leverage

A point that does not follow the pattern of the data and has a large residual

Outlier

A point that, if removed, substantially changes the slope, y intercept, correlation and coefficient of determination, or standard deviation of the residuals.

Influential point

media
media
media

13

Multiple Choice

Which of the following statements about residuals are true?

I. The mean of the residuals is always zero

II. The sum of the residuals is always zero

III. Influential points have large residuals

1

I only

2

I and II

3

I and III

4

I, II and III

14

Open Ended

Question image

A simple random sample of 9 students was selected from a large university. Each of these students reported a number of hours he or she had allocated to studying and the number of hours allocated to work each week. The least squares regression line was hours studied = 8.107 + 0.4919 hours workedhours\ studied\ =\ 8.107\ +\ 0.4919\ hours\ worked with an r2 value of 47.6%. A point P was removed from the data and a second linear regression was performed, the computer output is shown. Does point P exercise a large influence on the regression line? Explain.

15

media
media

Apply logs to both variables.

Transforming Power Models

Apply log to just the y.

Transforming Exponential Models.

media

16

Multiple Choice

Two measures x and y were taken on 18 subjects. THe first of two regressions, Regression I, yielded y^= 24.5 + 16.1x and had the top residual plot.

The second Regression, Regression II, yielded ^log(y)=1.6 +0.51 log(x) and had the second residual plot. Which of the following conclusions is best supported by the evidence above?

1

There is a linear relationship between x and y, and Regression I yields a better fit.

2

There is a linear relationship between x and y, and Regression II yields a better fit.

3

There is a nonlinear relationship between x and y and Regression I yields a better fit.

4

There is a nonlinear relationship between x and y and Regression II yields a better fit.

Chapter 3: Regression

Show answer

Auto Play

Slide 1 / 16

SLIDE