
Comparing measures of center and variation
Presentation
•
Mathematics
•
12th Grade
•
Easy

Kirby Pool
Used 2+ times
FREE Resource
6 Slides • 19 Questions
1

2


3

4

5

6
Dropdown

Using the given data, the best measure of center to compare the distributions is
.
7
Dropdown

Using the given data, the best measure of variation to compare the distributions is
.
8
Multiple Choice
9
Multiple Choice
10
Multiple Choice

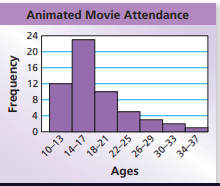
How is the graph distributed?
11
Multiple Choice
12
Multiple Choice

35 is
13
Multiple Choice
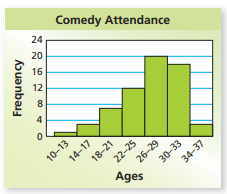
What is the shape of the data?
14
Multiple Choice

What is the shape of the data?
15
Multiple Choice
Which statement best describes this graph?
16
Multiple Choice

17
Multiple Choice
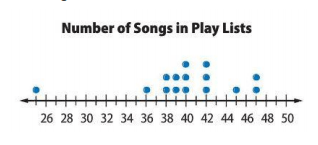
What value is the lower quartile?
18
Multiple Choice

Where is the gap in the data?
19
Multiple Choice

What is the interquartile of this data?
20
Multiple Choice
What is the shape of the data?
21

22
Drag and Drop

This distribution is
so we should use the
as a measure of center and the
as a measure of variability.
23
Drag and Drop

This distribution is
so we should use the
as a measure of center and the
as a measure of variability.
24
Fill in the Blanks

25
Multiple Choice

Which measure of variation would we use with this data?
Show answer
Auto Play
Slide 1 / 25
SLIDE
