
6th Nature of science Section 2- standards of measurement
Presentation
•
Science
•
6th Grade
•
Easy
+12
Standards-aligned
Tyanna Bailey
Used 2+ times
FREE Resource
25 Slides • 39 Questions
1
Nature of science
section 1
Standards of Measurement
2
Standards of Measurement Vocabulary
1. Get ten notecards
2. Write the word on the BLANK side
3. Write the definition on the LINED side
4. Tape your notecards in your science composition notebook. This is your vocabulary staircase!
3
1. International System of Units- the standard of measurement used worldwide
2. Length- the distance between two points
3. Volume- the amount of space an object takes up
4. Mass- the amount of matter in an object
5. Density- the mass per volume
6. Time- the interval between two occurring events.
7. Graph- a visual display of data
8. Bar graph- useful for comparing information collected by counting.
9. Circle Graph- used to show how a fixed quantity is broken down into parts.
4
use your note cards to answer the following questions
5
Multiple Choice
International system of units
standard system of measurement used world wide
non- standard system of measurement used world wide
standard system of measurement used in America only
standard system of measurement used in Argentina only
6
Multiple Choice
length
the distance between two points
the amount of time that has passed
the amount of days that has passed
the amount of years that has passed.
7
Multiple Choice
volume
the amount of space occupied by an object
the amount of time that has passed
the distance between two points
the amount of mass an object has
8
Multiple Choice
mass
the amount of matter in an object
the amount of water in an object
the amount of air in an object
the amount of weight in an object.
9
Multiple Choice
density
mass per unit volume of a material
the weight of an object
the height of an object
the length of an object
10
Multiple Choice
time
the interval between two occurring events
the distance between tow places
the length of an object
11
Multiple Choice
graph
a visual display of information or data
a written display of data or information
a numerical display of information or data
12
Multiple Choice
bar graph
useful for comparing information collected by counting
useful for making projects cute
useful for answering a question
13
Multiple Choice
circle graph
used to show how a fixed quantity is broken down into parts
used to show the answer
used to answer a question
used to make your project cute
14
Read and pay attention!
15
16
17
18
19
20
21
22
Different Types of Graphs

23
24
25
What was the average temp in 2011?
26
Multiple Choice
What was the average temp in 2011?
CLICK THE PICTURE
63.1
62
64
27
Which year had the highest temperature ?
28
Multiple Choice
Which year had the highest temperature ?
CLICK ON THE PICTURE TO MAKE IT BIGGER!!
2008
2013
2006
29
30
What does this graph say tell about these students after they prepared for the test ?
31
Multiple Choice
What does this graph say tell about these students after they prepared for the test ?
CLICK ON THE PICTURE TO MAKE IT BIGGER!!
That studying for a test will bring your score down.
That studying for a test will increase your score.
That if you eat a healthy breakfast you will do better on a test.
32
Which student only increased their score slightly?
33
Multiple Choice
Which student increased their score slightly?
CLICK ON THE PICTURE TO MAKE IT BIGGER!!!
Mack
Loretta
Dylan
34
35
What does this line plot graph show ?
36
Multiple Choice
What does this line plot graph show ?
CLICK ON THE PICTURE TO MAKE IT BIGGER!
How long students read for.
How long students studied for.
How long students were in class for.
37
Nine students studied for how many minutes ?
38
Multiple Choice
Nine students studied for how many minutes ?
50 seconds
50 minutes
50 hours
39
A pie graph or circle graph always equals ?
40
Multiple Choice
A pie graph (circle graph) always equals ....
CLICK THE PICTURE
50%
75%
100%
41
Multiple Choice
A pie graph is also called a ....
circle graph
round graph
sphere graph
42
What
43
Multiple Choice
How many people have two or less books in their desk?
CLICK THE PICTURE
44
Multiple Choice
Based on the graph, how many MORE students are in the science club than the book club?
CLICK THE PICTURE
20
16
46
18
45
Multiple Choice
The graph shows how employees at Disney World travel to work. How many employees ride bikes, ride the bus, or walk to work?
HINT: HOW DO YOU PUT IT ALL TOGETHER?????????
300
450
325
375
46
Multiple Choice
The bar graph shows data about the pets owned by math students in four classes. One bar is missing from the graph. If the students have a total of 32 dogs, which bar shows the number of dogs Ms. Davalos's class has?
CLICK THE PICTURE
47
Multiple Choice
Did more people own a Wii or a PS3?
Wii
PS3
48
Multiple Choice
What is the difference in the number of people who owned a Wii and the number who owned a Gameboy?
4
7
3
2
49
Multiple Choice
Which month had the greatest number of books read?
November
December
January
February
50
Multiple Choice
Which month had the fewest books read?
January
February
March
April
51
Multiple Choice
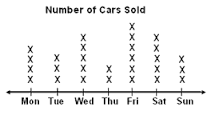
How many cars were sold on Saturday and Sunday?
CLICK THE PICTURE
52
Multiple Choice
What is the difference between the highest score and the lowest score on the test?
THINK: WHAT DOES DIFFERENCE MEAN IN MATH?!?!
CLICK THE PICTURE
53
Multiple Choice
54
Multiple Choice
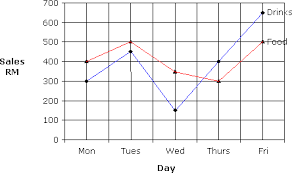
Which month had the biggest difference between the high and low temperatures?
January
April
October
November
55
Multiple Choice
56
Multiple Choice
57
Multiple Choice
Based on the graph, how many more students are in the science club than the book club?
20
16
46
18
58
Multiple Choice
The graph shows how employees at Disney World travel to work. How many employees ride bikes, ride the bus, or walk to work?
300
450
325
375
59
Multiple Choice
Did more people own a Wii or a PS3?
Wii
PS3
60
Multiple Choice
Which month had the greatest number of books read?
November
December
January
February
61
Multiple Choice
62
Multiple Choice
63
Multiple Choice
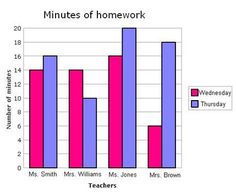
Which day had more minutes of homework?
CLICK THE PICTURE
64
Multiple Choice
Nature of science
section 1
Standards of Measurement
Show answer
Auto Play
Slide 1 / 64
SLIDE
Similar Resources on Wayground
56 questions
Longitudinal vs Transverse Waves
Presentation
•
6th Grade
56 questions
Compression or Longitudinal Waves Lesson
Presentation
•
6th Grade
56 questions
Parts of a Wave: Transverse and Longitudinal Waves
Presentation
•
6th Grade
56 questions
Colloids
Presentation
•
6th Grade
59 questions
The History of Canada
Presentation
•
6th Grade
60 questions
Valence Electrons Guided Lesson
Presentation
•
6th Grade
57 questions
Lesson 1.2 - Metabolism
Presentation
•
6th Grade
64 questions
Simple Machines and Efficiency Review
Presentation
•
6th Grade
Popular Resources on Wayground
19 questions
Naming Polygons
Quiz
•
3rd Grade
10 questions
Prime Factorization
Quiz
•
6th Grade
20 questions
Math Review
Quiz
•
3rd Grade
15 questions
Fast food
Quiz
•
7th Grade
20 questions
Main Idea and Details
Quiz
•
5th Grade
20 questions
Context Clues
Quiz
•
6th Grade
20 questions
Inferences
Quiz
•
4th Grade
19 questions
Classifying Quadrilaterals
Quiz
•
3rd Grade
Discover more resources for Science
16 questions
Interactions within Ecosystems
Presentation
•
6th - 8th Grade
20 questions
Rocks and The Rock Cycle
Quiz
•
6th Grade
20 questions
Moon Phases and Eclipses
Quiz
•
6th - 8th Grade
20 questions
Human Body Systems
Quiz
•
6th Grade
22 questions
6th & 8th Grade Science Material SOL Review
Quiz
•
6th - 8th Grade
15 questions
Punnett Squares
Quiz
•
6th Grade
20 questions
Cells! Cell Theory and Characteristics of Eukaryotes/Prokaryotes
Quiz
•
6th Grade
35 questions
Amplify Weather Patterns Unit Review
Quiz
•
6th Grade