Search Header Logo
APES Population Review

APES Population Review

Assessment

Presentation

•

Science

•

12th Grade

•

Easy

•
NGSS
MS-ESS1-1, MS-LS2-1, MS-LS2-4

+18

Standards-aligned

Created by

Evan Todd

Used 5+ times

FREE Resource

32 Slides • 94 Questions

1

APES Unit 3 Populations Review Module

2

3

4

media

5

media

6

media

7

media

8

media

9

media

10

media

11

media

12

media

13

media

14

media

15

media

16

media

17

media

18

media

19

media

20

media

21

media

22

media

23

media

24

media

25

media

26

media

27

media

28

media

29

media

30

media

31

media

32

media

33

Multiple Choice

What factor describes when populations decrease because animals are moving out of a population?

1

Emigration

2

Limiting Factors

3

Immigration

4

Exponential Growth

34

Multiple Choice

If the number of births is greater than the number of deaths in a population, what will happen to the growth of the population?
1
It will increase.
2
It will decrease.
3
It will stay the same.
4
It will fluctuate.

35

Multiple Choice

What growth model has an J-shaped curve?

1

Logistic

2

Exponential

36

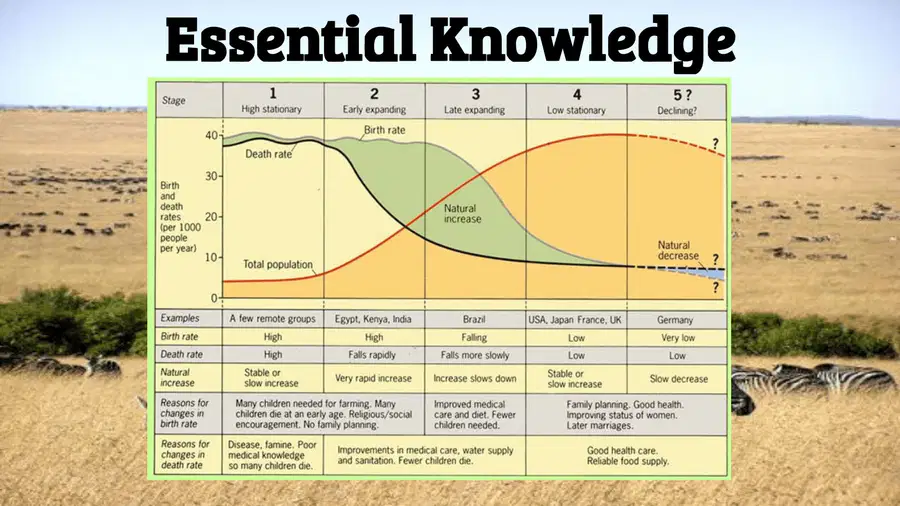
Multiple Choice

Question image
What does the graph represent?
1
Emigration
2
Exponential growth
3
Immigration
4
Logistic Growth

37

Multiple Choice

What growth model has an S-shaped curve?

1

Logistic

2

Exponential

38

Multiple Choice

Largest number of individuals of a population that the environment can support...  
1
carrying capacity
2
population crash
3
lag phase
4
mutualism

39

Multiple Choice

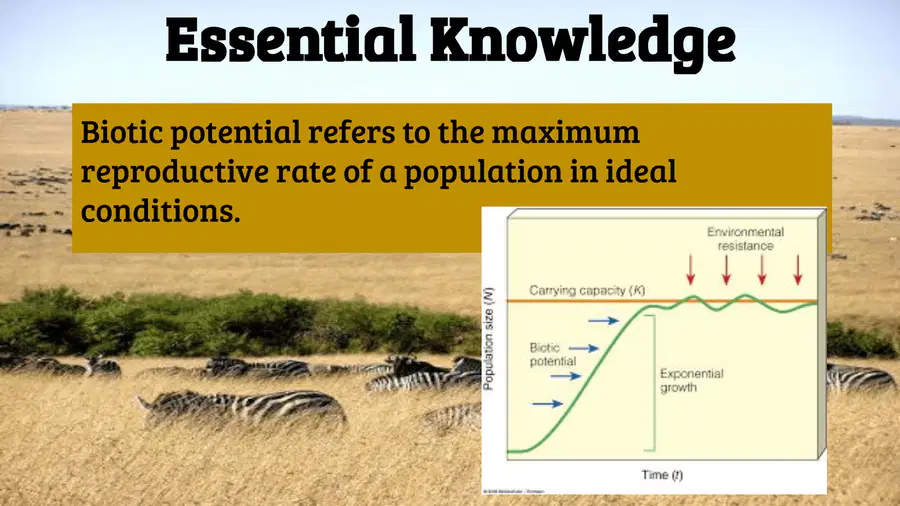
When a population has unlimited resources, and it continues to grow to its FULL LIVING POTENTIAL, it is called

1

Peak

2

Top shelf

3

Resource controlled limit

4

Biotic potential

40

Multiple Choice

Which limiting factor is independent of the number of individuals in a population?
1
competition
2
parasitism/disease
3
stress
4
natural disasters

41

Multiple Choice

factors that affect a population depending on its size​

- these include food, predation, parasitism, and disease​

1

Density-Dependent factor

2

Density-Independent factors

42

Multiple Choice

Question image
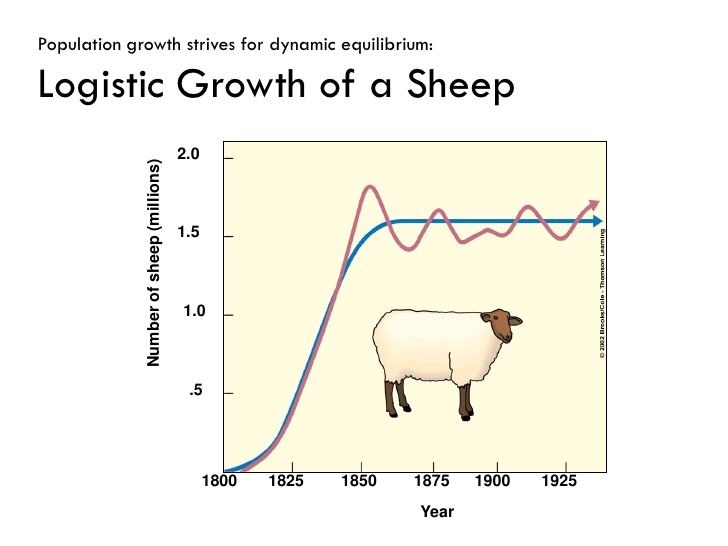
What is the carrying capacity for this sheep population?
1
1.8 million
2
1.25 million
3
1.6 million
4
1.o million

43

Multiple Choice

affect all populations similarly regardless of population size.​ Examples include: natural disasters, rapid climate changes (drought or floods), and human activity and disturbances ​

1

Density-Dependent factors

2

Density-Independent factors

44

Multiple Choice

Question image

What point on the graph represents the carrying capacity?

1

A

2

B

3

C

4

D

45

Multiple Choice

Describes how many individuals of different ages make up a population​

1

Age Structure

2

Age Layout

3

The youths collation

4

Age Spread

46

Multiple Choice

Question image
What point on the graph represents the carrying capacity?
1
A
2
B
3
C
4
D

47

Multiple Choice

Which population has the greatest potential for rapid growth?

1

Populations with a large number of middle aged individuals

2

Older populations

3

Populations with large numbers of young offspring

4

None of these

48

Multiple Choice

A population is...

1

All members of one species in one area

2

All members of all species that live in one area

3

All of the living and nonliving things in an area

4

None of these

49

Multiple Choice

Population pyramids measure:

1

Age and Gender

2

Gender and Race

3

Age and Race

4

Land size

50

Multiple Choice

Question image
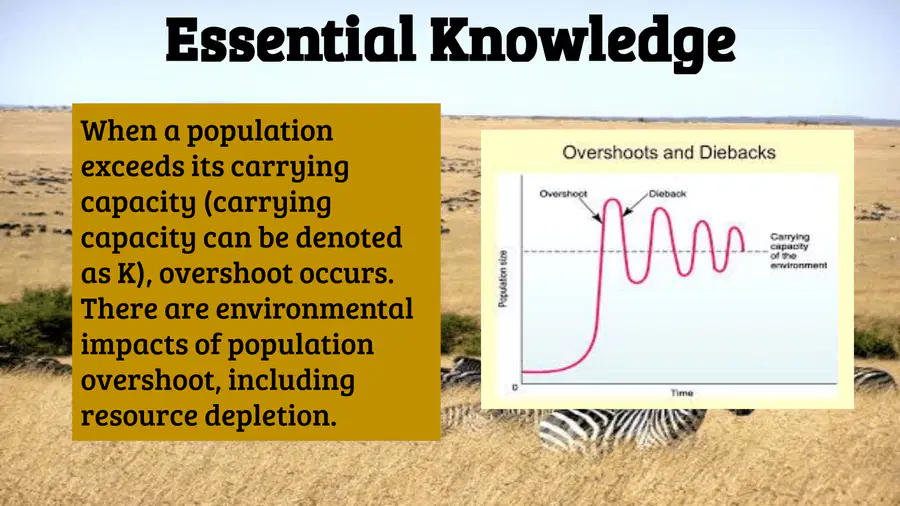
When a population grows past the ecosystem's carrying capacity, what happens to the population?
1
Continues to grow
2
The population starts to die off to return to carrying capcity
3
The population will go extinct due to lack of resources
4
The population grows then finds a new carrying capacity

51

Multiple Choice

Question image

What age groups does the bottom of a population pyramid represent?

1

The elderly

2

The working adults

3

The children

4

Males

52

Multiple Choice

Which factor is a density-dependent limiting factor on the population of a species?
1
seasonal variation
2
natural disasters
3
unusual weather
4
predation

53

Multiple Choice

Question image

What growth rate does this population pyramid represent?

1

Rapid Growth

2

Slow Growth

3

Negative Growth

4

Zero Growth

54

Multiple Choice

Food, water, sunlight, shelter, and space are resources that are often __________.
1
limiting factors
2
wet
3
messy
4
found in rocks

55

Multiple Choice

Lower birth rate

1

More developed

2

Less developed

56

Multiple Choice

Question image

What is happening at the 'A' on the graph?

1

the population overshoots above the carrying capacity

2

the population stops growing

3

growth begins to slow down due to limited resources

4

growth is speeding up due to an abundance of resources

57

Multiple Choice

Question image

Is this country Developed or Developing?

1

Developed

2

Developing

58

Multiple Choice

Any thing or organism that regulates the size of a population of another organism is known as __________.
1
a limiting measure
2
a limiting factor
3
factorization
4
materialization of precipitation

59

Multiple Choice

Any thing or organism that regulates the size of a population of another organism is known as __________.
1
a limiting measure
2
a limiting factor
3
factorization
4
materialization of precipitation

60

Multiple Choice

To measure population density, you must divide the number of individuals living in a defined space by the
1
area of the space
2
birth and death rates
3
carrying capacity
4
height of the space

61

Multiple Select

Which of the following are density dependent factors?

1

competition for resources

2

predation

3

disease

4

natural disasters

62

Multiple Choice

Natural disasters can be considered limiting factors.
1
true
2
false

63

Multiple Select

Which of the following are examples of a density independent factors?

1

forest fire

2

seasonal cycles

3

storms

4

disease

64

Multiple Choice

Nesting birds often space themselves evenly from other nests. This pattern is called
1
clumped dispersion.
2
uniform dispersion.
3
random dispersion
4
scatter dispersion

65

Multiple Choice

Question image
What is the carrying capacity for this sheep population?
1
1.8 million
2
1.25 million
3
1.6 million
4
1.o million

66

Multiple Choice

What is the correct equation for calculating population growth rate?

1

Births + Deaths

2

Births - Deaths

3

Deaths / Births

4

Deaths x Births

67

Multiple Choice

Question image
When a population grows past the ecosystem's carrying capacity, what happens to the population?
1
Continues to grow
2
The population starts to die off to return to carrying capcity
3
The population will go extinct due to lack of resources
4
The population grows then finds a new carrying capacity

68

Multiple Choice

Question image
Lichens and mosses that first live in uninhabited areas are examples of
1
secondary species
2
non-native species
3
pioneer species
4
climax species

69

Multiple Choice

What factor describes when populations decrease because animals are moving out of a population?

1

Emigration

2

Limiting Factors

3

Immigration

4

Exponential Growth

70

Multiple Choice

Which of these is not one of the properties of a population?

1

Density

2

Dispersion

3

Size

4

Degree

71

Multiple Choice

Question image

What point on the graph represents the carrying capacity?

1

A

2

B

3

C

4

D

72

Multiple Choice

Question image
Which threat to biodiversity is being displayed?
1
overexploitation
2
invasive species
3
pollution
4
habitat fragmentation

73

Multiple Choice

Nesting birds often space themselves evenly from other nests. This pattern is called
1
clumped dispersion.
2
uniform dispersion.
3
random dispersion
4
scatter dispersion

74

Multiple Choice

Which of the following is not an example of exponential growth?

1

A.reindeer of the Probilof Islands after eating most of the Lichens

2

A.rabbit populations after being introduced to Australia

3

A.a bank account that earns interest

4

A.mold appearing on bread overnight

75

Multiple Choice

Question image
Lichens and mosses that first live in uninhabited areas are examples of
1
secondary species
2
non-native species
3
pioneer species
4
climax species

76

Multiple Choice

Species that could become endangered in the near future are called
1
unlucky
2
extinct
3
endangered
4
threatened

77

Multiple Choice

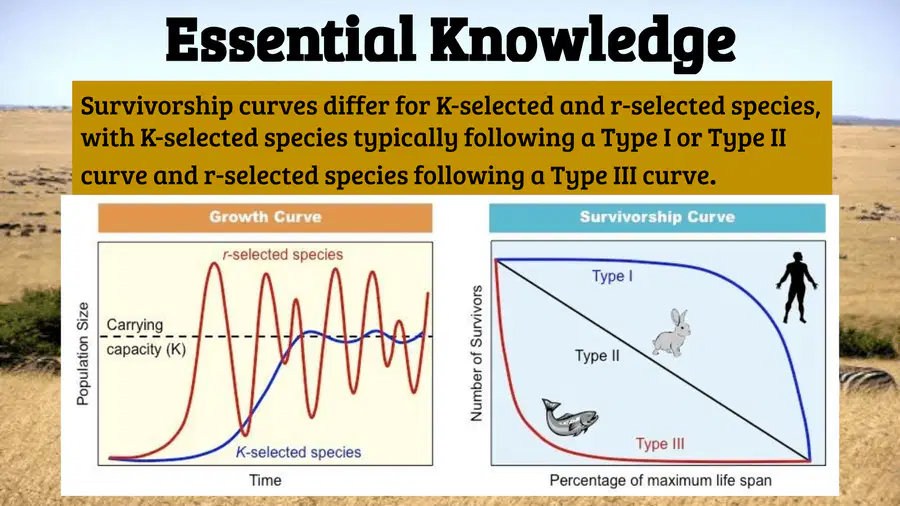
A species described as r-strategist would definitely NOT have which of the following characteristics?
1
clumped population pattern
2
much parenting
3
many offspring
4
random population pattern

78

Multiple Choice

Question image

Type of dispersion of a large population of mallard ducks gathered together in a marsh?

1

flock dispersion

2

balanced dispersion

3

random dispersion

4

clumped dispersion

79

Multiple Choice

________ grow slowly over time, cares for its young over a long period of time and is usually near the carrying capacity of its ecosystem.
1
K-strategists
2
R-strategists
3
Uniform strategists
4
environmentalists

80

Multiple Choice

The sea otter is a(n) ___________ that influences the survival of many other species in its ecosystem.
1
Cute furry creature
2
endangered species
3
keystone species
4
important animal

81

Multiple Choice

Question image
Represents the biotic potential of the species
1
A
2
B
3
D
4
E

82

Multiple Choice

Which of the following variables increase population size?

1

Deaths

2

Emigration

3

Immigration

83

Multiple Choice

Question image

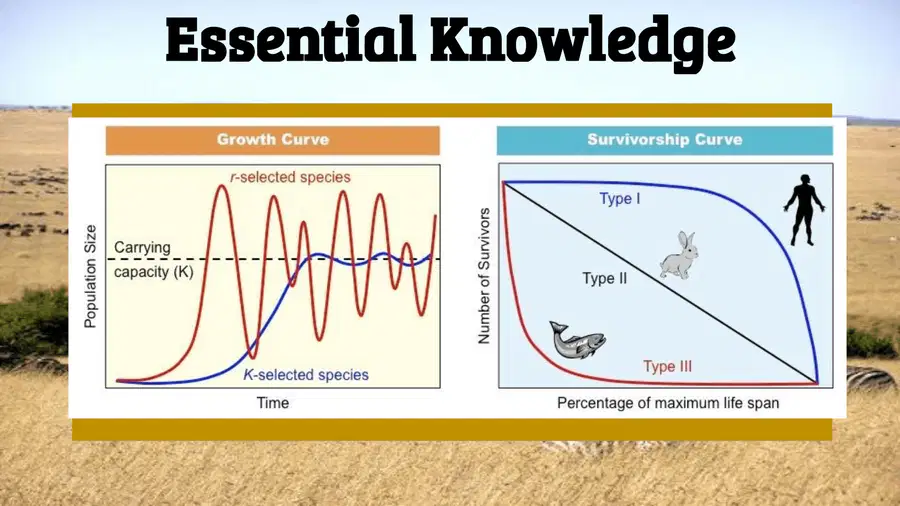
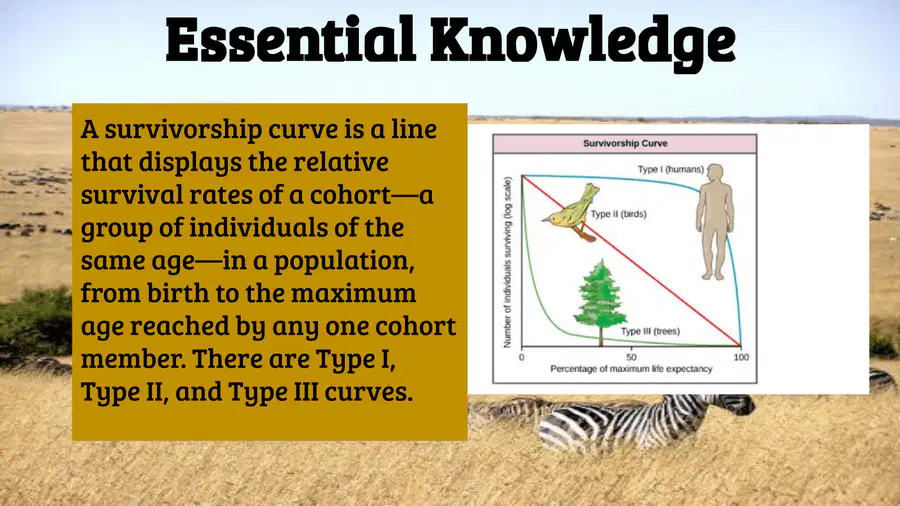
Tracks organisms that tend to live long lives (low death rate and high survivorship rate); toward the end of their life expectancies, however, there is a dramatic increase in the death rate.

1

Type I

2

Type II

3

Type III

4

Type IV

84

Multiple Choice

Which of these would NOT be true of a specialist species?
1
They are more likely to go extinct during changes to an ecosystem. 
2
They have a very narrow niche.
3
They often lose in competition for resources to generalists. 
4
They often feed on a very specific diet. 

85

Multiple Choice

Question image

Describes organisms with a high death rate (or low survivorship rate) immediately following birth. Examples include bacteria, fishes, and invertebrates.

1

Type I

2

Type II

3

Type III

4

Type IV

86

Multiple Choice

Question image
What does the graph represent?
1
Emigration
2
Exponential growth
3
Immigration
4
Logistic Growth

87

Multiple Choice

These organisms typically live in unstable, unpredictable environments & are able to reproduce rapidly (exponentially). They do not take care of their young & are subject to predation.

1

k-strategist

2

r-strategist

3

m-strategist

4

s-strategist

88

Multiple Choice

Introduced or invasive species are often difficult because:
1
They contribute to habitat fragmentation
2
They do not adapt well to new environments
3
They increase biodiversity
4
They often lack natural predators

89

Multiple Choice

These organisms occupy stable environments, are larger in size and have longer life expectancies. They produce, during their life spans, fewer offspring, but place a greater investment in each.

1

k-strategist

2

r-strategist

3

m-strategist

4

s-strategist

90

Multiple Choice

Which limiting factor is independent of the number of individuals in a population?
1
competition
2
parasitism/disease
3
stress
4
natural disasters

91

Multiple Select

Click density dependent factor(s).

1

competition for resources

2

predator-prey relationships

3

parasitism and disease

4

weather

92

Multiple Choice

A species described as r-strategist would definitely NOT have which of the following characteristics?
1
clumped population pattern
2
much parenting
3
many offspring
4
random population pattern

93

Multiple Select

Click density independent factor(s).

1

competition for resources

2

predator-prey relationships

3

parasitism and disease

4

weather, natural disaster and man made disturbances

94

Multiple Choice

Which factor is a density-dependent limiting factor on the population of a species?
1
seasonal variation
2
natural disasters
3
unusual weather
4
predation

95

Multiple Choice

Question image

A pattern of survival over time in which there is high survival throughout most of the life span, but then individuals start to die in large numbers as they approach old age.

1

Type i survivorship

2

Type ii survivorship

3

Type iii survivorship

96

Multiple Choice

Question image
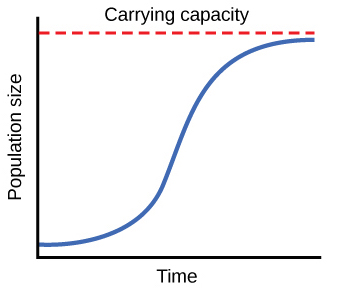
__________ growth shows growth of a population under environmental constraints (carrying capacity-K) that sets a maximum population size 
1
logistic
2
exponential
3
niche
4
uniform

97

Multiple Choice

Question image

A pattern of survival over time in which there is a relatively constant decline in survivorship throughout most of the life span.

1

Type ii survivorship

2

Type i survivorship

3

Type iii survivorship

98

Multiple Choice

Question image

What is happening at the 'A' on the graph?

1

the population overshoots above the carrying capacity

2

the population stops growing

3

growth begins to slow down due to limited resources

4

growth is speeding up due to an abundance of resources

99

Multiple Choice

Question image

A pattern of survival over time in which there is low survivorship early in life with few individuals reaching adulthood.

1

Type III survivorship

2

Type II survivorship

3

Type I survivorship

100

Multiple Choice

________ grow slowly over time, cares for its young over a long period of time and is usually near the carrying capacity of its ecosystem.
1
K-strategists
2
R-strategists
3
Uniform strategists
4
environmentalists

101

Multiple Choice

A generalist species is a species that generally has a wide range of things in their diets as well as a relatively large area of habitat.

1

Generalists

2

Specialist

102

Multiple Choice

To measure population density, you must divide the number of individuals living in a defined space by the
1
area of the space
2
birth and death rates
3
carrying capacity
4
height of the space

103

Multiple Choice

Organisms adapted to narrow habitats, limited food resources, or other specific environmental conditions.

1

Specialist

2

Generalist

104

Multiple Choice

J-Shaped curves
1
show a decline after an increase
2
display populations that have reached carrying capacity
3
represent exponential growth
4
does not depend on the numbe rof resources

105

Multiple Choice

Human population growth in 2020 was 0.98 %. If this growth were to remain constant in what year will the human population double?

1

2051

2

2091

3

2109

4

9120

106

Multiple Choice

Nesting birds often space themselves evenly from other nests. This pattern is called
1
clumped dispersion.
2
uniform dispersion.
3
random dispersion
4
scatter dispersion

107

Fill in the Blanks

Human population growth of Mozambique in 2021 was 2.8. If growth remains constant, in what year will the human population double?

108

Multiple Choice

Two male Giraffes are fighting over the last green leaf of a tree that is dying.

1

Intraspecific Competition

2

Mutualsim

3

Predation

4

Commensalism

5

Interspecific Competition

109

Multiple Choice

In 2004 China's CBR was 11.8 the CDR was 6.3. what is the growth rate for China in 2004?

1

0.38%

2

0.49%

3

0.55%

4

0.68%

110

Multiple Choice

Question image
__________ growth shows growth of a population under environmental constraints (carrying capacity-K) that sets a maximum population size 
1
logistic
2
exponential
3
niche
4
uniform

111

Multiple Choice

Which of the following is most typically associated with the transition form a rural to an urbanized society?

1

Reduced birth rates

2

Reduced need for sewage-treatment facilities

3

Increased rates of population growth

4

Increased air quality in urban areas

5

Increased stabilization of microclimate in urban areas.

112

Multiple Choice

Question image
Represents the biotic potential of the species
1
A
2
B
3
D
4
E

113

Multiple Choice

High birthrate and high death rate means the total population is low

1

stage 1

2

stage 2

3

stage 3

4

stage 4

5

stage 5

114

Multiple Choice

Population increases at a constant rate over time.

1

Exponential Growth

2

Logistic Growth

3

Stable Growth

4

Strategic Growth

115

Multiple Choice

Which describes the birth and death rate of Stage 3 of the DTM?

1

The death rate is decreasing and birth rate remains high

2

Both the death and birth rate are high

3

The death rate is low but the birth rate is high

4

Both the birth rate and death rate are decreasing

116

Multiple Choice

Which describes the birth and death rate of Stage 2 of the DTM?

1

The death rate is decreasing and birth rate remains high

2

Both the death and birth rate are high

3

The death rate is low but the birth rate is high

4

Both the birth rate and death rate are decreasing

117

Multiple Choice

Question image

In Stage 1, the birth rate is...

1

High

2

Falling

3

Low

118

Multiple Choice

Question image

In Stage 1, the death rate is...

1

High

2

Falling

3

Low

119

Multiple Choice

Question image

In Stage 2, the Total Population is...

1

Growing Slowly

2

Growing Quickly

3

Not Growing

120

Multiple Choice

Question image

In Stage 3, the Birth Rate is...

1

High

2

Dropping quickly

3

Low

121

Multiple Choice

Question image

In Stage 4, the Death rate is...

1

High

2

Rising

3

Low

122

Multiple Choice

Question image

In Stage 4, the Total Population is...

1

Growing Quickly

2

Leveling Out

3

Decreasing Quickly

123

Multiple Choice

In Stage 4, the Population Pyramid looks like...

1
2
3

124

Multiple Choice

Question image

What stage is this country in?

1

Stage 1

2

Stage 2

3

Stage 3

125

Multiple Choice

Question image

A characteristic of stage one of the Demographic Transition Model shows

1

High birth and death rates

2

Low death and high birth rates

3

Low birth and death rates

4

High death and low birth rates

126

Multiple Choice

Question image

Which correctly describes the term demographic transition?

1

The transition from low birth rates and death rates to high birth rates and death rates as a country develops.

2

The transition from high birth rates and death rates to low birth rates and death rates as a country develops.

3

The transition from high birth rates to low death rates as a country develops.

4

The transition from low birth rates to high death rates as a country develops.

pattern-tertiary
APES Unit 3 Populations Review Module

Show answer

Auto Play

Slide 1 / 126

SLIDE