Search Header Logo
  1. Resource Library
  2. Math
  3. Data And Graphing
  4. ...
  5. Scatter Plots
Scatter Plots

Scatter Plots

Assessment

Presentation

Mathematics

12th Grade

Practice Problem

Medium

CCSS
8.EE.B.5, HSS.ID.B.5

Standards-aligned

Created by

Kristin Thibault

Used 6+ times

FREE Resource

10 Slides • 7 Questions

1

media
media

Scatter Plots

2

media

Scatter Plot – a graph of ordered pairs

on a coordinate plane that shows the
relationship between a set of data
with two variables.

Scatter Plots and Lines of Fit

3

media
media

Positive correlation

4

media
media

Negative Correlation

5

media
media

Correlation Coefficient

6

media
media

Correlation Coefficient

7

media
media

No correlation

8

Multiple Choice

Which correlation coefficient shows a strong negative relationship?

1

-0.9

2

-0.09

3

0.8

4

-.03

9

Multiple Choice

If the Correlation Coefficient is 0.2 it is

1

weak and negative

2

weak and positive

3

strong and positive

4

strong and negative

5

no correlation

10

media

Lines of Fit

When the data points all lie close to a line we can

draw a line of fit to show the trend in the data.

Steps:
1.

Make a scatter plot and determine if a relationship
exists.

2.

Draw a line that seems to pass close to most of the data
points.

3.

WRITE THE EQUATION OF THE LINE
Use two points on the line of fit to write an equation for
the line.

11

media

MCAS

Examples

12

Multiple Choice

Question image

MCAS

1

A

2

B

3

C

4

D

13

Multiple Choice

Question image
1

A

2

B

3

C

4

D

14

Multiple Choice

Question image
1

A

2

B

3

C

4

D

15

Multiple Choice

Question image
1

A

2

B

3

C

4

D

16

media
media

Choose the point (1, 151) and (8, 230)

To write our equation we must first find

the slope m = y2 – y1

x2 – x1

M = 230 – 151

8-1

Now we know the slope and a
point so we can use point slope
form: y – y1 = m (x- x1)

Y – 151 = 11.3 (x – 1)

“predict the drop of a roller coaster 30
years after 1988”

Y – 151 = 11.3 (30-1)
Y – 151 = 11.3 (29)
Y – 151 = 327.7
Y= 428.7

So, 30 years after 1988 the drop of the
roller coaster would be about 429 feet.

17

Multiple Choice

Question image

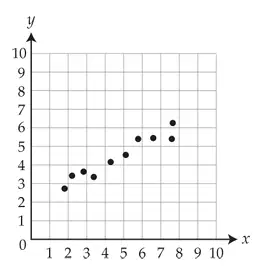
Which equation best represents the scatterplot shown?

1

y=1/3x+2

2

y=1/2x+2

3

y=1/2x+1

4

y=2x+2

media
media

Scatter Plots

Show answer

Auto Play

Slide 1 / 17

SLIDE