Search Header Logo
 Introduction to the Definite Integral Lesson

Introduction to the Definite Integral Lesson

Assessment

Presentation

Mathematics

10th Grade

Easy

Created by

Larry Cooper

Used 3+ times

FREE Resource

16 Slides • 23 Questions

1

media

​Introduction to the Definite Integral Lesson

media

"Using Knowledge wisely will give you the Power to leap to tomorrow's edge."

By: Mr. C.

2

3

media

4

media

5

Multiple Choice

Question image

Using the areas of each region given
acf(x)=\int_a^cf\left(x\right)=  . #1

1

20

2

-7

3

-10

4

-4

6

Multiple Choice

Question image

Using the areas of each region given
adf(x)=\int_a^df\left(x\right)=  #3

1

6

2

20

3

2

4

24

7

Fill in the Blank

Question image

The graph of y=3x2+12x9y=-3x^2+12x-9 is shown. Find the area under the curve between x = 1, and x = 3. #48

Use the TI 84 Calculator.

8

media

9

media

10

media

11

media

12

media

13

14

Multiple Choice

Question image

A Riemann Sum uses rectangles to...#18

1

approximate the area under a curve. The more rectangles, the better the approximation.

2

approximate the area under a curve. The less rectangles, the better the approximation.

3

approximate the area under a curve. The more rectangles, the worse the approximation.

15

Multiple Choice

What is the meaning of the following symbol? #36

abf(x)dx\int_a^bf\left(x\right)dx  

1

The area from the curve to the x-axis from x = a to x = b

2

The rate at which f(x) is changing from x = a to x = b

3

The area from the curve to the y-axis from x = a to x = b

4

The volume when the curve is rotated about the x-axis from x = a to x = b

16

Multiple Choice

Question image

Classify as an underestimate or overestimate. #11

1

Underestimate

2

Overestimate

17

Multiple Choice

Question image

For a function that is strictly increasing, a right hand Riemann Sum is which of the following: #30

1
Overestimate
2
Underestimate
3
Unable to Determine
4
Exact Solution

18

Multiple Choice

Question image

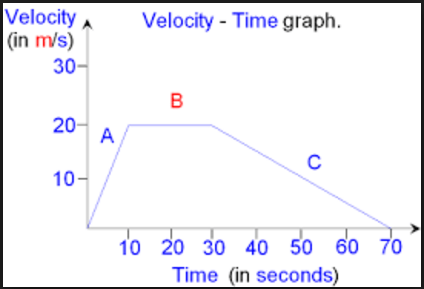
This is a velocity-time graph: What is the displacement of the object between 30 and 70 seconds? (area under curve) #43

1

800 m

2

600 m

3

400 m

4

- 0.5 m

19

Multiple Choice

Question image

This graph shows the speed of a car during its first 6 seconds. How far did the car travel (displacement) during the last 2 seconds (4 - 6 s)? #45

1

10 m

2

20 m

3

10 m/s

4

20 m/s

20

Multiple Choice

Question image

Calculate the distance travelled in section C. #46

1

200 m

2

300 m

3

400 m

4

500 m

21

22

web page not embeddable

Left & right Riemann sums (article) | Khan Academy

You can open this webpage in a new tab.

23

Multiple Choice

Question image

Is the graph using the Left, Right, or Midpoint Rule? #12

1

left

2

right

3

midpoint

4

none

24

Multiple Choice

Question image

Is the graph using Left, Right, or Midpoint Rule? #10

1

left

2

right

3

midpoint

4

none

25

Multiple Choice

Question image

What does this picture represent? #33

1

Left Riemann Sum

2

Right Riemann Sum

3

Middle Riemann Sum

4

Trapezoidal Sum

26

27

Multiple Choice

Question image

Based on the table, use a left Riemann sum and 4 sub-intervals to estimate the Area under the curve. (Choose the correct set-up.) #4

1
5(3) + 1(4) + 2(5) + 1(7)
2
5(4) + 1(5) + 2(7) + 1(6)
3
5(3) + 6(4) + 8(5) + 9(7)
4
0(3) + 5(4) + 6(5) + 8(7)

28

Multiple Choice

Question image

Find the right-hand Riemann Sum, with three sub-intervals indicated by the table. #5

1

28

2

16

3

34

4

21

29

30

Multiple Choice

Question image

Calculate the approximation for the given function & interval. #6


R3, f(x) = 7 - x, [3, 5]

1

16/3

2

5

3

26/3

4

DNE

31

Multiple Choice

Question image

#15

1

1.5

2

1.1418

3

1.1

4

1.4914

32

Multiple Choice

Question image

#16

1

35

2

40.625

3

32.1

4

41

33

Multiple Choice

Question image

What is the approximate area of the region, using 4 subintervals and heights using left values? #23

1

7.5

2

7.75

3

10

4

11.5

34

35

Multiple Choice

Question image

Use a Midpoint Riemann Sum to approximate the area between 0 to 3 with 3 subintervals. #38

1

14

2

7

3

26

4

11

36

Multiple Choice

Question image

Find the area under the curve y =3x2-2x from x= 1 to x =5. Do not use your calculator. Use the Midpoint Rule with 4 subintervals for the graph shown. #39

1

100

2

99

3

150

4

152

37

38

Multiple Choice

Question image

Based on the table, use a trapezoidal sum of 4 sub-intervals to estimate the area under the curve. #53

1

32.5

2

40.5

3

78

4

160

39

Multiple Choice

Question image

Use 3 trapezoids to determine the approximate area of the shaded area. #54

1

12

2

9

3

10

4

5

media

​Introduction to the Definite Integral Lesson

media

"Using Knowledge wisely will give you the Power to leap to tomorrow's edge."

By: Mr. C.

Show answer

Auto Play

Slide 1 / 39

SLIDE