
Dot Plots
Presentation
•
Mathematics
•
5th Grade
•
Medium
•
CCSS
6.NS.B.3, 6.SP.B.4, 2.MD.D.9
+4
Standards-aligned

Folasade Adeoye
Used 6+ times
FREE Resource
4 Slides • 8 Questions
1

2

3

4


5
Multiple Choice

What is the maximum amount of goals scored?
6
Fill in the Blanks

Type answer...
7
Multiple Choice

How many people exercised for at least 3 hours?
8
Multiple Choice

What was the median number of hours spent playing video games?
9
Fill in the Blanks

Type answer...
10
Multiple Choice
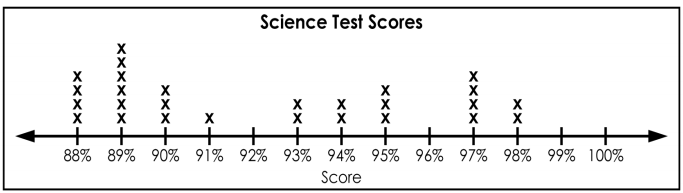
What is the difference between students that earned less than an 89 and a 97 or more?
11
Fill in the Blanks
Type answer...
12
Multiple Choice

The dot plot shows scores on a science test. What is the difference between people that got more than a 90 and those that got an 80 or less?
Show answer
Auto Play
Slide 1 / 12
SLIDE
