
Climates and Interpreting Data from Maps
Presentation
•
Science
•
5th Grade
•
Practice Problem
•
Medium
+7
Standards-aligned
BAILEY BROWN
Used 5+ times
FREE Resource
5 Slides • 24 Questions
1
Climates & Interpreting Data from Maps
2
Description: Climographs show the average temperature and precipitation in an area over the course of the year. Websites like climatecharts.net can be used to quickly identify patterns of climate around the world.
3
Hotspot
Click on the X Axis of this graph.
4
Hotspot
Click on the Y Axis of this graph.
5
Categorize
6
Where are each of those countries located?
7
Multiple Choice
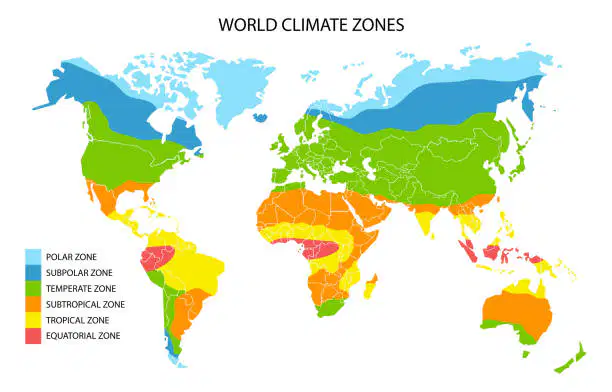
Which of these locations is in a Temperate Zone?
Michigan
Russia
India
Dominican Republic
8
Multiple Choice
Which of these locations is in a Subpolar Zone?
Michigan
Russia
India
Dominican Republic
9
Multiple Choice
Which of these locations is in a Subtropical Zone?
Michigan
Russia
India
Dominican Republic
10
Multiple Choice
Which of these locations is in a Tropical Zone?
Michigan
Russia
India
Dominican Republic
11
Multiple Choice
Based on the climate data from Michigan, how can we characterize a Temperate Climate?
Warm/Hot year round with a rainy season
Cold almost year round with some precipitation (mostly snow)
All four seasons with moderate precipitation year round
Warm temperatures year round with an extremely rainy season
12
Multiple Choice
Based on the climate data from the Dominican Republic, how can we characterize a Tropical Climate?
Warm/Hot year round with a rainy season
Cold almost year round with some precipitation (mostly snow)
All four seasons with moderate precipitation year round
Warm temperatures year round with an extremely rainy season
13
Multiple Choice
Based on the climate data from Russia, how can we characterize a
Subpolar Climate?
Warm/Hot year round with a rainy season
Cold almost year round with some precipitation (mostly snow)
All four seasons with moderate precipitation year round
Warm temperatures year round with an extremely rainy season
14
Multiple Choice
Based on the climate data from India, how can we characterize a
Subtropical Climate?
Warm/Hot year round with a rainy season
Cold almost year round with some precipitation (mostly snow)
All four seasons with moderate precipitation year round
Warm temperatures year round with an extremely rainy season
15
Open Ended
Summarize three things you've learned about world climates.
16
Case Study: Maddie's Earthquakes
While doing research for her science class Maddie reads an article about an earthquake that occurred in the county of Kent. Maddie lives in Manchester, UK and worries that her city might experience a similar event.
17
Draw
Read the following article and circle important information that would help Maddie begin her research into the earthquakes of the UK.
18
Categorize
None
Very few in Ireland. Most were in the West side of the UK
Two islands of Europe
North and South of Ireland, West and North of the UK
Organize these observations that Maddie made into the right categories
19
Multiple Choice
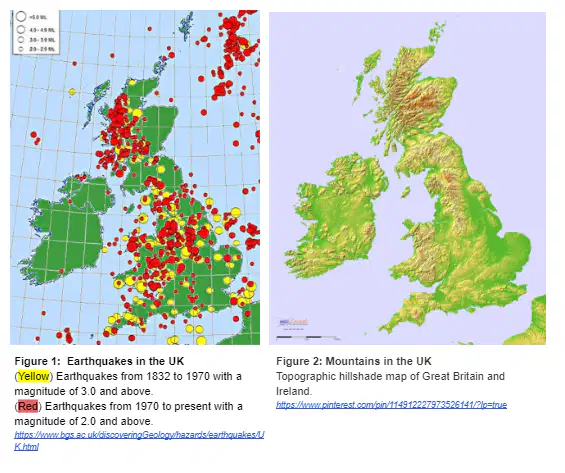
What can we observe about the locations of mountains and the location of earthquakes in the UK?
The earthquakes are mostly occurring away from the mountain ranges
The earthquakes are mostly occurring close to the mountain ranges
20
Multiple Choice
What can we infer is likely causing the earthquakes given their proximity to the mountain ranges?
21
Open Ended
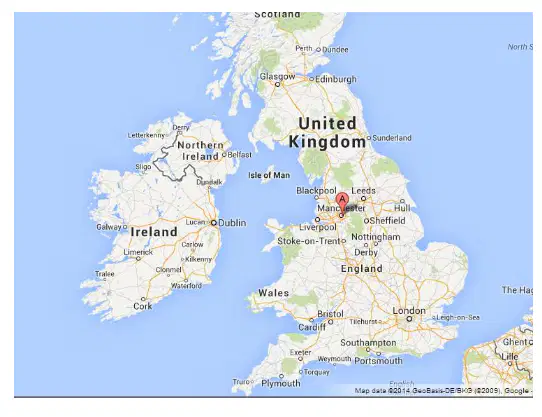
Maddie lives in Manchester. Should she be concerned about future earthquakes in her city? Explain your thinking.
22
Review of
Topographic Maps
23
Multiple Choice
Contour lines are
Imaginary lines that circle the Earth in a north and south direction
Imaginary lines that circle the Earth in an east and swest direction
the curved lines on a topographic map
the equator and prime meridian
24
Multiple Choice
Elevation is
the height above sea level
the curved lines on a topographic map
a small box that lists symbols and tells what they stand for
maps that show shape and elevation of the Earth's surface
25
Multiple Choice
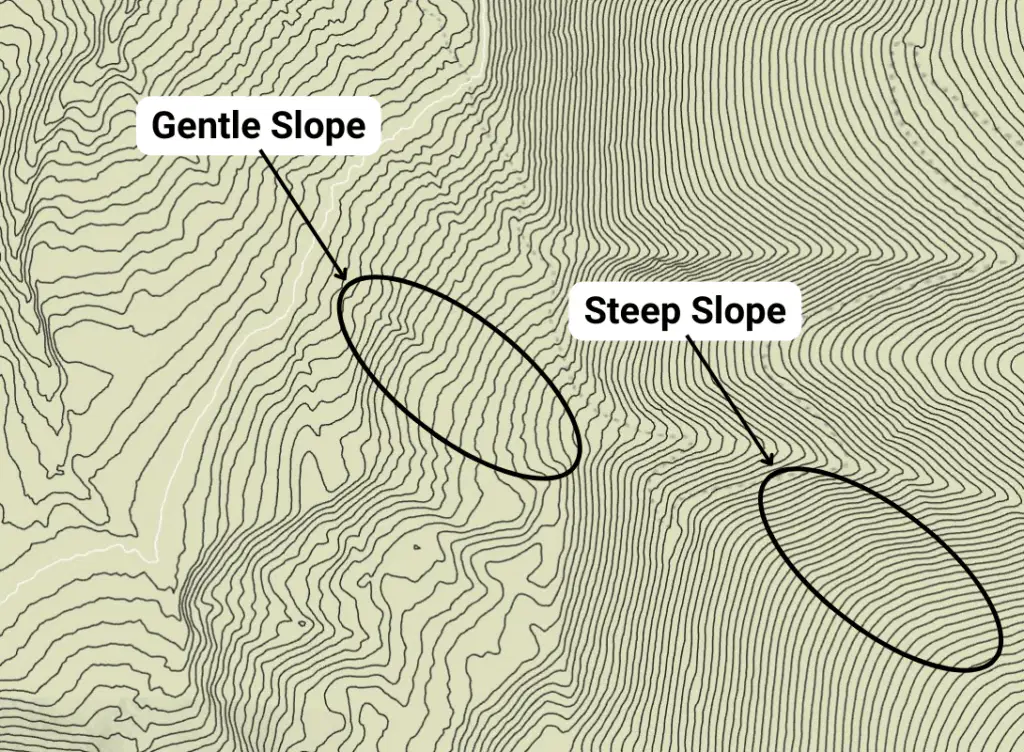
If contour lines on a topographic map are close together, then the slope is
gentle
flat
steep
going up and down
26
Multiple Choice
What is the highest elevation on this map?
650 m
500 m
400 m
300 m
27
Multiple Choice
What is the highest elevation on this map?
100
200
400
500
28
Multiple Choice
What is the lowest elevation on this map?
500
300
100
200
29
Open Ended
In your own words, describe the difference you will see on a topographic map when the slope of a hill/mountain is steep or gentle.
Climates & Interpreting Data from Maps
Show answer
Auto Play
Slide 1 / 29
SLIDE
Similar Resources on Wayground
21 questions
Landforms and Oceans
Presentation
•
5th Grade
25 questions
What causes day and night?
Presentation
•
5th Grade
25 questions
Quizizz Lesson: Symbiosis Examples
Presentation
•
5th Grade
23 questions
Learned and Inherited behaviors
Presentation
•
5th - 6th Grade
21 questions
Earth's Layers & Plate Movement
Presentation
•
5th - 6th Grade
22 questions
Thermal Energy: Conductors & Insulators
Presentation
•
5th Grade
19 questions
Atoms
Presentation
•
5th Grade
23 questions
Mixtures and Solutions
Presentation
•
5th Grade
Popular Resources on Wayground
10 questions
Factors 4th grade
Quiz
•
4th Grade
10 questions
Cinco de Mayo Trivia Questions
Interactive video
•
3rd - 5th Grade
13 questions
Cinco de mayo
Interactive video
•
6th - 8th Grade
20 questions
Math Review
Quiz
•
3rd Grade
20 questions
Main Idea and Details
Quiz
•
5th Grade
20 questions
Context Clues
Quiz
•
6th Grade
20 questions
Inferences
Quiz
•
4th Grade
19 questions
Classifying Quadrilaterals
Quiz
•
3rd Grade
Discover more resources for Science
48 questions
5th Grade FSA Science Review
Quiz
•
5th Grade
20 questions
Science Review
Quiz
•
5th Grade
20 questions
Food Chains and Food Webs Review
Quiz
•
5th Grade
29 questions
5th Grade Science EOG Review Weather/Matter/Body Systems
Quiz
•
5th Grade
45 questions
Science SOL Review 1
Quiz
•
5th Grade
31 questions
Science - 5th Grade Final Exam Review
Quiz
•
5th Grade
21 questions
Solar System Review
Quiz
•
5th Grade
118 questions
5th Grade SSA Review_Mr. Hite
Quiz
•
3rd - 5th Grade