Search Header Logo
  1. Resource Library
  2. Math
  3. Algebra
  4. Linear Relationships
  5. Unit 5 Day 1 Linear Relationships
Unit 5 - Day 1 - Linear Relationships

Unit 5 - Day 1 - Linear Relationships

Assessment

Presentation

Mathematics

9th - 12th Grade

Medium

CCSS
8.EE.B.5, 8.F.A.3, 8.F.B.4

+5

Standards-aligned

Created by

Lindsay Guntharp

Used 2+ times

FREE Resource

12 Slides • 39 Questions

1

Identifying Linear Equations Notes

Unit 4: Two Variable Linear Equations

media

2

Remember, "m" is the same as the constant or the unit rate. In this equation, it is the "slope".

The y-intercept determines where the line starts on ​coordinate plane and if it is a proportional relationship or not.

Slope-intercept form

media

3

​Objectives:

​Students will be able to...

​- Identify linear functions in tables, graphs and functions

- Find the x and y intercepts of a graph

​- Graph linear equations using the x and y intercepts

4

Open Ended

Question image

1. How can you tell by looking at a graph that a relationship is linear?

5

Open Ended

Question image

2. How can you tell by looking at an algebraic equation or function rule that the relationship is linear?

6

Open Ended

Question image

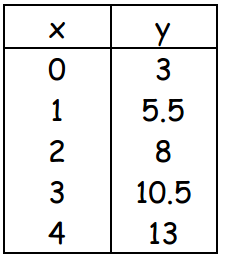
3. How can you tell by looking at a table of values that a relationship is linear?

7

Multiple Select

Which graphs represent linear functions? Select all that apply.

1
2
3
4

8

Given a Table of Values

​Use the notes on "Given a Table of Values" to help answer the next couple of questions. ​

9

Multiple Choice

Which table of values represents a linear function?

1
2
3
4

10

Multiple Choice

Which set of ordered pairs represents a linear function?

1

{(3, 10),(1, 9),(1, 7),(3, 4),(5, 0)}\left\{\left(-3,\ 10\right),\left(-1,\ 9\right),\left(1,\ 7\right),\left(3,\ 4\right),\left(5,\ 0\right)\right\}

2

{(3, 4),(5, 7),(7, 10),(9, 13),(11, 16)}\left\{\left(3,\ 4\right),\left(5,\ 7\right),\left(7,\ 10\right),\left(9,\ 13\right),\left(11,\ 16\right)\right\}

11

Linear vs. Non-linear

  • Linear functions form a straight line and have a constant increase or decrease of y as x increases or decreases

  • Non-linear functions do not form a straight line and as x increases, y does not increase at a constant rate

media

12

Multiple Choice

y = 6x + 5y\ =\ 6x\ +\ 5  

1

Linear

2

Nonlinear

13

Multiple Choice

Question image

Linear or Nonlinear?

1

Linear

2

Non-Linear

14

Multiple Choice

Question image

Linear or Nonlinear?

1

Linear

2

Non-Linear

15

Multiple Choice

Question image

Linear or Nonlinear?

1

Linear

2

Non-Linear

16

Multiple Select

Which of the following functions are linear? Select all that apply.

1

2y=3x22y=-3x^2

2

y=4x7y=4x-7

3

y=3x+4y=\frac{3}{x}+4

4

y=3xy=3^x

5

3x+y=1-3x+y=1

17

Drag and Drop

Question image


x-intercept is the point ​


y-intercept is the point ​
Drag these tiles and drop them in the correct blank above
(2, 0)
(0, 4)
2
4
(0, 2)
(4, 0)
(-2, 0)
(0, -4)

18

Drag and Drop

Question image


x-intercept is the point ​


y-intercept is the point ​
Drag these tiles and drop them in the correct blank above
(6, 0)
(0, -4)
6
-4
(0, 6)
(-4, 0)
(0, 4)
(-6, 0)

19

Multiple Choice

Question image

What is the x and y intercepts for the linear function shown on the graph?

1

x intercept: (0, 2)\left(0,\ -2\right)  

y intercept: (3, 0)\left(-3,\ 0\right)  

2

x intercept: (2, 0)\left(2,\ 0\right)  

y intercept: (0, 3)\left(0,\ 3\right)  

3

x intercept: (2, 0)\left(-2,\ 0\right)  

y intercept:  (0, 3)\left(0,\ -3\right)  

4

x intercept: (0, 2)\left(0,\ 2\right)  

y intercept: (3, 0)\left(3,\ 0\right)  

20

Multiple Choice

In an x intercept, which value is always 0?

1

the x value

2

the y value

21

Slope of a Line

media

22

Slope

  • Slope measures the steepness of a line

  • Known as rate of change

  • Known as rise over run

  • Know as change in y over change in x

  • Slope is represented by the variable "m"

media

23

Finding the Slope from Two Points

  • Slope formula: (y2- y1 ) / (x 2 - x1 )

  • Each point in the coordinate plane can be represented as an ordered pair (x, y)

  • Label each set of points as (x , y ) and (x , y ). 

  • To find the slope, subtract the y-values and divide by the difference of the x-values

media

24

Slope from Two Points in a Table

  • Subtract y-values = numerator

  • Subtract corresponding x-values = denominator

  • Always reduce slope (simplifying the fraction)

media

25

Multiple Choice

Question image
What is the slope?
1
5
2
1/5
3
15
4
10

26

Multiple Choice

Question image
What is the slope?
1
2/5
2
5/2
3
3
4
5.5

27

Multiple Choice

Question image
What is the slope?
1
-21
2
-17
3
1/4
4
4

28

Slope and Rate of Change

  • Slope also refers to the line, while rate of change makes more sense when we talk about how the dependent variable changes with respect to the dependent variable


media

29

Multiple Choice

Question image
During a snowstorm, John measured the total snowfall accumulated at the end of each hour.  He recorded his results in the table below.  What is the approximate average rate of change of the snowfall between 1 p.m. and 6 p.m.?
1
0.7 inch/hour
2
0.9 inch/hour
3
1.1 inch/hour
4
1.4 inch/hour

30

Multiple Choice

Question image

Find the rate of change.

1

-2 minutes per gallon

2

-20 minutes per gallon

3

-2 gallons per minute

4

-20 gallons per minute

31

Multiple Choice

Question image

Find the rate of change.

1

-2 minutes per gallon

2

-20 minutes per gallon

3

-2 gallons per minute

4

-20 gallons per minute

32

Multiple Choice

Question image

What type of correlation does the given graph show?

1

Postive

2

Negative

3

No Correlation

33

Multiple Choice

Question image

What type of correlation does the given graph show?

1

Postive

2

Negative

3

No correlation

34

Multiple Choice

Question image

What type of correlation does the given graph show?

1

Positive

2

Negative

3

No correlation

35

What is a line of best fit?

When data is collected, points do not form a straight line, but they may approximate to a linear relationship


A trend line or line of best fit is a line that is

VERY CLOSE to most of the data points.


It is used to make conjectures (predictions)

media

36

Multiple Choice

Which graph shows the best line of fit?

1
2
3
4

37

Multiple Choice

Which graph shows the best line of fit?

1
2
3
4

38

Multiple Choice

Which graph shows the best line of fit?

1
2
3
4

39

Multiple Choice

Which graph shows the best line of fit?

1
2
3
4

40

Multiple Choice

Question image

Which graph shows a line of best fit (trend line) for the scatter plot?

1

Graph A

2

Graph B

3

Graph C

4

Graph D

41

Multiple Choice

Question image
Which of the following lines represents the line of best fit for the scatter plot?
1
A
2
B
3
C
4
D

42

Multiple Choice

What is a trend line used for?

1

To make predictions

2

To make the graph look pretty

3

To connect the points

43

Make a prediction!

What will the weight of the shipment be for 7 books?

media

44

Multiple Choice

Question image
Based on the scatterplot, about how much money would a group of 10 people be expected to spend on food and beverages at this restaurant?
1
$135
2
$115
3
$105
4
$150

45

Multiple Choice

Question image

Based on this scatterplot, approximately what score would a student with 6 absences expect to receive on the final exam?

1

65

2

92

3

67

4

76

46

Multiple Choice

Question image
Based on the trend in the data, approximately how many free throws would a player be expected to make if he attempted 60 free throws?
1
50
2
35
3
25
4
60

47

Multiple Choice

Question image

Based on the scatterplot, what is the best prediction of the average amount of money spent on groceries for a household of7 people?

1

$240

2

$190

3

$210

4

$300

48

Multiple Choice

Question image
Based on the scatterplot, what is the best prediction of the average number of hours a person spends at work every week, if that person spends an average of 10 hours on recreational activities every week?
1
33 hours
2
85 hours
3
50 hours
4
65 hours

49

Multiple Choice

Question image

1

A

2

B

3

C

4

D

50

Multiple Choice

Question image

1

A

2

B

3

C

4

D

51

Open Ended

What did you learn from these slides?

Identifying Linear Equations Notes

Unit 4: Two Variable Linear Equations

media

Show answer

Auto Play

Slide 1 / 51

SLIDE