
Speed Time Graphs
Presentation
•
Science
•
9th - 12th Grade
•
Medium
+14
Standards-aligned

Whitney Ratliff
Used 6+ times
FREE Resource
25 Slides • 23 Questions
1

2

3

4

5

6

7

8

9

10

11

12

13

14

15

16

17

18

19

20

21

22

23

24

25

26
Multiple Choice
27
Multiple Choice
28
Multiple Choice
29
Multiple Choice
30
Multiple Choice
31
Multiple Choice
32
Multiple Choice
33
Multiple Choice
34
Multiple Choice
35
Multiple Choice
36
Multiple Choice
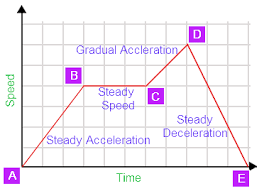
At what point is the speed the greatest?
37
Multiple Choice

What is happening during point C to D?
38
Multiple Choice
39
Multiple Choice
40
Multiple Choice

41
Multiple Choice

42
Multiple Choice

How long did it take Charlie to finish the race?
43
Multiple Choice
44
Multiple Choice

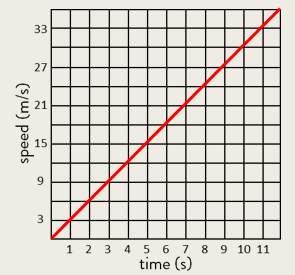
What is the graph showing?
45
Multiple Choice
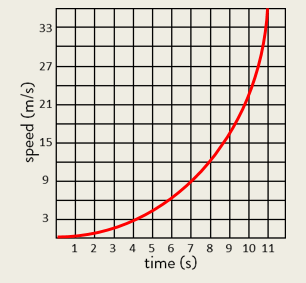
What is this graph showing?
46
Multiple Choice

What is this graph showing?
47
Multiple Choice
48
Multiple Choice
Show answer
Auto Play
Slide 1 / 48
SLIDE
