Search Header Logo
  1. Resource Library
  2. Math
  3. Algebra
  4. Linear Relationships
  5. Unit 2 Quiz Review Proportional And Linear Relationships
Unit 2 Quiz Review - Proportional and Linear Relationships

Unit 2 Quiz Review - Proportional and Linear Relationships

Assessment

Presentation

Mathematics

8th Grade

Practice Problem

Medium

CCSS
8.EE.B.5, 8.F.B.4, 8.F.A.1

+6

Standards-aligned

Created by

Larry Walker

Used 7+ times

FREE Resource

1 Slide • 11 Questions

1

media

2

Multiple Choice

PARTNER-PRACTICE

1. Which graph appears to show a linear non-proportional relationship between x and y?

1
2
3
4

3

Dropdown

Question image
PARTNER-PRACTICE

2. Consider the following graph.  Determine the slope and y-intercept of the graphed line.

slope (m): ​
y-intercept (b): ​ ​

4

Multiple Choice

Question image

PARTNER-PRACTICE

3. Cars leave a parking lot after a football game.  The table shows the linear relationship between the number of cars remaining in the parking lot and the number of hours after the game ends. ​ Which equation can be used to determine y, the number of cars remaining in the parking lot x hours after the game ended?

1

y= -15,000x + 60,000

2

y= -15,000x + 45,000

3

y= 15,000x + 45,000

4

y= 15,000x + 60,000

5

Multiple Choice

PARTNER-PRACTICE

4. Alexander has $80 in his checking account, and he adds $25 every month.  Based on this information, which representation best shows the relationship between the amount of money Alexander has in his checking account, y, and the number of months that have passed, x?

1
2
3
4

6

Multiple Choice

PARTNER-PRACTICE

5. Which table of ordered pairs, when plotted, will show a linear non-proportional relationship between x and y?

1
2
3
4

7

Multiple Choice

Question image

PARTNER-PRACTICE

6. Nathaniel is playing skee-ball at his cousins birthday party.  His goal was to get the most bull's eyes made for the highest points.  Nathaniel created a table of the record for the points for collected. Based on the information from the table and the problem situation, which statement is true?

1

The table and situation represents a linear proportional relationship.

2

The table and situation represents a linear non-proportional relationship.

3

The rate of change in the table is 4,800 points per bull's eye.

4

The rate of change is 2,000 points per bull's eye.

8

Multiple Choice

Question image

PARTNER-PRACTICE

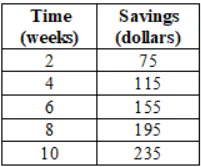
7. Juan's savings over several weeks are shown in the table provided.  If a linear equation models his savings over time, how much money did he initially have to begin with?

1

Zero dollars

2

$20.00

3

$35.00

4

$75.00

9

Multiple Choice

Question image

PARTNER-PRACTICE

8. Triangle ABC and triangle EBD are similar right triangles. The coordinates of all vertices are integers.

NOTE: 1st Quarterly Exam Question - 24% Correct Overall

1

The relationship between the slope of BC and the slope of BD cannot be determined because the triangles are overlapping.

2

The slope of BC is equal to the slope of BD, because the ratios of the rise/run are the same for BC as it is for BD.

3

The slope of BC is greater than the slope of BD, because the ratio of the change in y-values to the change in x-values is greater for BC than it is for BD.

4

The slope of BC is less than the slope of BD, because the ratio of the change in y-values to the change in x-values is less for BC than it is for BD.

10

Hotspot

PARTNER-PRACTICE

9. A survey of students at Athens Middle School revealed that 8 out of 10 students prefer pepperoni on their pizza. Which points best represent the slope of the line that shows the relationship between y, the number of students who prefer pepperoni on their pizza, and x, the total number of students?

SELECT TWO CORRECT POINTS

NOTE: 1st Quarterly Exam Question - 36% Correct Overall

11

Hotspot

PARTNER-PRACTICE

10. The graph of linear relationship passes through the points (-6, -5) and (6, 1). What is the y-intercept (b) of linear graph?

SELECT ONE CORRECT POINT

NOTE: 1st Quarterly Exam Question - 24% Correct Overall

12

Multiple Choice

Exit Ticket - TEK 8.5H

David's younger brother has 15 toys in his toy-box, and he adds 2 new toys every month.  Based on this information, which representation best shows this relationship between the number of toys in the toy-box, y, and the number of months that have passed, x?

1
2
3
4
media

Show answer

Auto Play

Slide 1 / 12

SLIDE