

G8 S1 Project Week PPT (Exponential Graphs)

Presentation
•
Mathematics
•
8th Grade
•
Hard

William Green
FREE Resource
8 Slides • 0 Questions
1
Linear, Quadratic and Exponential Graphs
2
Lesson Objectives
By reading key features of exponential graphs and watching videos, learn about this new graph.
New Graph: Exponential Graph
By reading key features of Linear and Quadratic Graphs, refresh your memories on these graphs.
Review Linear and Quadratic Graphs
3


y = mx + c is the general equation for a straight-line graph.
‘m’ is equal to the gradient of the graph.
‘c’ is the value where the line crosses the y-axis and is called the y-intercept.
Linear Graphs
y = ax² + bx + c is the general equation for a quadratic graph
Axis of Symmetry
Vertex
Y-intercept
X-intercepts (Roots)
Quadratic Graphs
f(x) = a
Exponential Graphs
x
x
x
4
Exponential Functions
An exponential function is one in which the input occurs as a power. It is written in the form:


5
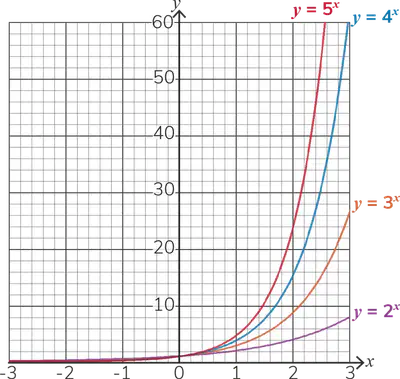
Let’s take a look at the graph of y = ax for integer values of a from 2 to 5 inclusive.
The larger the value of a, the steeper the graph, but all take the same basic shape.
6

Now, we’ll consider what happens when a is less than 1, but greater than 0.
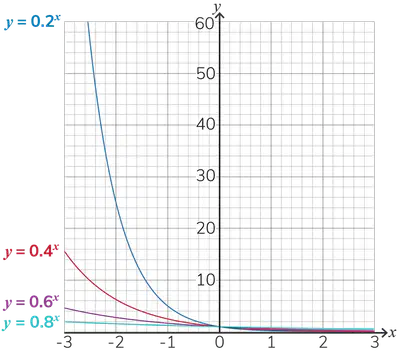
As before, the graph intersects the y-axis at 1. However, compared to functions where a > 1, the shape of the graph has been reflected in the y-axis.
As x decreases below 0, the output increases, and very small, negative x values give us large outputs.
As x increases above 0, the output again tends towards 0 and the asymptote at y = 0 remains.
This time, the smaller the value of a, the steeper the graphs, but when 0 < a < 1, our gradients are always negative – the function is purely decreasing.
7

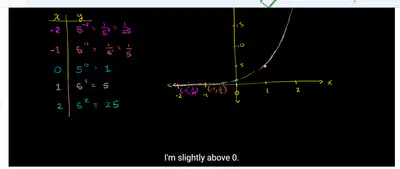
Learn more from videos
https://www.khanacademy.org/math/algebra/x2f8bb11595b61c86:exponential-growth-decay/x2f8bb11595b61c86:graphs-of-exponential-growth/v/graphing-exponential-functions
8
Connect algebra to real life in this Graphing Linear, Exponential and Quadratic Functions Regression Project.
This project based learning activity is perfect for students to write a linear, quadratic, or exponential equation, graph the scatter plot and function, and analyze the data.
Real Life Application

Linear, Quadratic and Exponential Graphs
Show answer
Auto Play
Slide 1 / 8
SLIDE
Similar Resources on Wayground

9 questions
Geometry 8
Presentation
•
8th Grade
9 questions
prime factorization
Presentation
•
8th Grade
6 questions
pythagorean theorem
Presentation
•
8th Grade
10 questions
Intro to the Pythagorean Theorem
Presentation
•
8th Grade
8 questions
Distribution/Combine Like Terms
Presentation
•
7th Grade
6 questions
Straight Line Graphs Revision
Presentation
•
8th Grade
6 questions
Count to 50
Presentation
•
KG
6 questions
statistika
Presentation
•
8th Grade
Popular Resources on Wayground
19 questions
Naming Polygons

Quiz
•
3rd Grade
10 questions
Prime Factorization
Quiz
•
6th Grade
20 questions
Math Review
Quiz
•
3rd Grade
15 questions
Fast food
Quiz
•
7th Grade
20 questions
Main Idea and Details
Quiz
•
5th Grade
20 questions
Context Clues
Quiz
•
6th Grade
20 questions
Inferences
Quiz
•
4th Grade
19 questions
Classifying Quadrilaterals
Quiz
•
3rd Grade
Discover more resources for Mathematics
48 questions
8TH GRADE MATH FAST REVIEW
Quiz
•
8th Grade
20 questions
summer trivia
Quiz
•
8th Grade
20 questions
Multi Step Equations with Variables on Both Sides
Quiz
•
8th Grade
20 questions
Scatter Plots and Line of Best Fit
Quiz
•
8th Grade
20 questions
Pythagorean Theorem Review
Quiz
•
8th Grade
12 questions
8th U8L8 Finding Unknown Side Lengths
Quiz
•
8th Grade
55 questions
8th Grade Math Review
Quiz
•
8th Grade
20 questions
Slope from a Graph
Quiz
•
8th Grade