Search Header Logo
Module 5 Lesson 19

Module 5 Lesson 19

Assessment

Presentation

Mathematics

8th Grade

Hard

Created by

James Gonzalez

FREE Resource

11 Slides • 24 Questions

1

Module 5

Test Review

media

Lab Review

2

Graphs

Mapping

Identifying Functions

Some text here about the topic of discussion

media
media

​Tables

media

3

Things to remember

Every x value has only one y value

Vertical Line Test - A vertical line can only pass through the graph once.

Some text here about the topic of discussion

4

Multiple Choice

Question image
1

Function

2

Not a Function

5

Multiple Choice

Question image
1

Function

2

Not a Function

6

Multiple Choice

Question image
1

Function

2

Not a Function

7

Complete a table given a function.

Some text here about the topic of discussion.

Completing Function Tables

media

8

Multiple Choice

Question image

Which equation matches the table?

1

y = x + 5

2

y = 5x

3

y = x - 5

4

x = y - 5

9

Multiple Choice

Question image

Which table of values can be defined by y = x + 5?

1

a

2

b

3

c

10

Multiple Choice

Question image

Find the missing OUTPUT value.

1

-2

2

3

3

9

4

-7

11

This is the packet we worked on for three days.

Some text here about the topic of discussion.

Construct Linear Functions

media

12

Initial value

​Where does the graph cross the y axis, what is the original amount at the start. What does not change.

Find the y intercept

Constant rate of change

​In word problems look for wat is changing. For example mi/hr, cost per day, etc

Find the slope.

Construct Linear Functions

Some text here about the topic of discussion

13

Multiple Choice

Question image

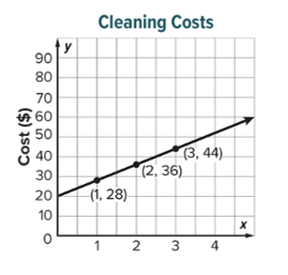
Write an equation for the cleaning cost, y, for the number of hours, x. Put in y = mx + b form.

1

y = 12x + 20

2

y = 20x + 8

3

y = 8x

4

y = 8x + 20

14

Multiple Choice

Question image

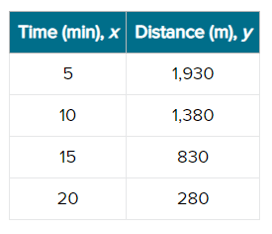
The table shows a linear relationship between the distance Penelope is from the park as she walks to soccer practice. Find the rate of change. Hint: her distance is getting closer.

1

110 meters per minute

2

550 meters per minute

3

-110 meters per minute

4

550 meters per minute

15

Multiple Choice

Question image

1

Rate of Change: $20, Initial Value: $3

2

Rate of Change: $3, Initial Value: $8

3

Rate of Change: $8, Initial Value: $20

16

Multiple Choice

When Charlotte planted her tomato plant, it grew 3 inches in one week. After 5 weeks, the tomato plant was 23 inches tall. Assume the relationship is linear. What linear equation represents this situation?

1

y = 5x + 3

2

y = 3x + 23

3

y = 3x + 8

4

y = 8x + 15

17

Multiple Choice

Question image

Write an equation for the line that represents Penelope's distance, y, from soccer practice after x minutes. Use y = mx + b.

1

y = -110x + 2480

2

y = 110x + 2000

3

y = -110x +2040

4

y = 5x +1930

18

Compare Linear Functions

media

19

Comparing Linear Functions

Find the slope, rate of change, and y intercept, initial value, of each function and then compare.

S

20

Open Ended

Question image

What is the rate of change for each function, and which one has the greater rate of change?

21

Multiple Choice

Question image

Compare the initial values of each function.

1

The initial value of item I is greater than the initial value of item II.

2

The initial value of item I is equal to the initial value of item II.

3

The initial value of item II is greater than the initial value of item I.

22

Multiple Choice

Question image

Which linear function has the greatest slope?

1

A

2

B

3

C

4

D

23

Multiple Choice

Question image

Compare the rates that each rental store charges per hour.

1

Water's Edge Rafts has a lower rate because they charge $6 per hour.

2

Water's Edge Rafts has a lower rate because they charge $5 per hour.

3

Ryan's Rafts has a lower rate because they charge $2.25 per hour.

4

Ryan's Rafts has a lower rate because they charge $15.00 per hour.

24

Multiple Choice

What has the GREATER rate of change.

1

y = 7x + 10

2

Someone who starts with $6 and gets $8 each day.

3

y = 5x + 20

4

Someone who starts with $8 and gets $6 each day.

25

Some text here about the topic of discussion.

Nonlinear Functions

media

26

Nonlinear Functions...

are represented by equations that have:

* exponents

* absolute value signs

* fractions with variables in the denominator

media

27

Multiple Choice

Question image

Which function creates this graph?

1

y=xy=x

2

y=2xy=2x

3

y=x2y=x^2

4

y=xy=\sqrt{x}

28

Multiple Choice

Question image
Is this function linear or nonlinear?
1

Linear

2

Nonlinear

29

Multiple Choice

Question image

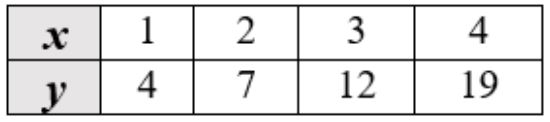
Is the function represented by the table linear or nonlinear?

1

linear

2

nonlinear

30

Multiple Choice

Question image
Is the graph pictured a linear or nonlinear function?
1

Linear

2

Nonlinear

31

Tuesday's Topic

Some text here about the topic of discussion.

Qualitative Graphs

media

32

Multiple Choice

Question image

The graph shows the speed of Mr. May driving to work. Which section shows Mr. May driving on the interstate?

1

a. - his rate of change is the steepest

2

b. - he's going the fastest here

3

g. - steep rate of change and not for a long time

4

d. - shortest amount of time

5

f. - he's going fast here

33

Multiple Choice

Question image

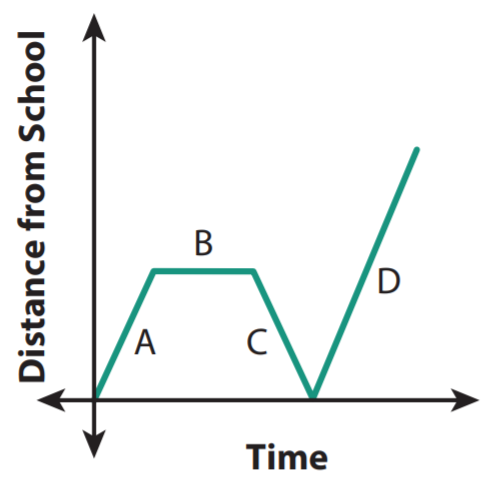
The graph shows Alex's distance as he leaves school one afternoon. What happens in section C? Why is the distance from school decreasing?

1

Timmy is walking back to school because he forgot his chromebook.

2

Timmy is talking to a friend and not walking.

3

Timmy is walking faster home.

4

Timmy is dancing in the street.

34

Multiple Choice

Question image

Choose the the graph that best depicts a man taking a ride on a ferris wheel.

1

a

2

b

3

c

4

d

35

Multiple Choice

Question image
1

A

2

B

3

C

4

D

Module 5

Test Review

media

Lab Review

Show answer

Auto Play

Slide 1 / 35

SLIDE