
Empirical Rule Lesson
Presentation
•
Mathematics
•
11th Grade
•
Hard

James Gonzalez
FREE Resource
31 Slides • 6 Questions
1
Empirical Rule
(68-95-99.7 Rule)
You will be filling in your notes in your packet, so please have that out as you go through this powerpoint.
2

Turn to this page in your notes, first!
Shapes
3

This distribution is "Skewed Right"
(The tail is on the right)
There is a lot of low numbers, and not a lot of high numbers.
Examples:
# of siblings people have
# of pets people have
4

This distribution is "Symmetrical"
or
"Normal"
There is a lot of average/middle values
Examples:
IQ level
PSAT Scores
5

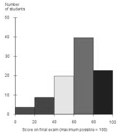
This distribution is "Skewed Left"
(The tail is on the left)
There is a lot of high numbers, and not a lot of
low numbers.
Examples:
Grades on an easy test
6
Multiple Choice
How would you describe this data?
Skewed Left
Skewed Right
Symmetrical
7
Multiple Choice
8
Multiple Choice

9
Multiple Choice

What is the shape of the distribution?
Skewed Left
Skewed Right
Symmetrical
10
Multiple Choice

What is the shape of the distribution?
Skewed left
Skewed right
Symmetrical
11
Multiple Choice

This data is
symmetrical
skewed right
skewed left
12

Turn to this page in your notes!
We are going to dive into "Normal" Shapes and what makes data normal
Empirical Rule
13
Fill in the blanks!

68%
1
95%
2
3
99.7%
14
The mean is always in the middle of our picture/distribution. Then we use the standard deviations to "jump" from value to value.
What does this mean?
15
Turn to this page in your notes!
Empirical Rule

16

(step 1)
Focus on the tick marks on the bottom of the curve
(step 2)
Write the mean (from the problem) in the middle
70
17
(step 3)
Find the standard deviation (in the problem) is 5
(step 4)
Count by 5's along the bottom line (each tick mark)
70
75
80
85
65
60
55
18
Flip back to this page :)
Empirical Rule
19

68%
According to the definition above this picture, 68% of our data falls within one standard deviation (jump) from the mean. This, inturn, means each section is worth 34% & 34%
34
34
20
95%
According to the definition above this picture, 95% of our data falls within two standard deviations (jumps) from the mean. This, inturn, means the next two sections are worth 13.5% & 13.5%
34
34
13.5
13.5
21
99.7%
According to the definition above this picture, 99.7% of our data falls within three standard deviations (jumps) from the mean. This, inturn, means the next two sections are worth 2.35% & 2.35%
34
34
13.5
13.5
2.35
2.35
22
According to the definition above this picture, our whole curve is worth 100%. This, inturn, means the very last two sections are worth .15% & .15%
Adding ALL of these percents up means the curve adds up to 100%
34
34
13.5
13.5
2.35
2.35
.15
.15
23
Flip back to this page!
Empirical Rule
24
The percents are the SAME exact percents EVERY time. So we can use the percents from the previous slides to fill in these gaps...
click next to see this!
70
75
80
85
65
60
55
25
We need to put these percentages here before each problem.
70
75
80
85
65
60
55
34%
34%
13.5%
13.5%
2.35%
2.35%
.15%
.15%
26
70
75
80
85
65
60
55
34%
34%
13.5%
13.5%
2.35%
2.35%
.15%
.15%

To answer this question, add up the percents that are between the values of 65 and 75 on our number line!
27
70
75
80
85
65
60
55
34%
34%
13.5%
13.5%
2.35%
2.35%
.15%
.15%
Answer: 34% + 34% = 68%
28
70
75
80
85
65
60
55
34%
34%
13.5%
13.5%
2.35%
2.35%
.15%
.15%

Answer: 13.5%
29
70
75
80
85
65
60
55
34%
34%
13.5%
13.5%
2.35%
2.35%
.15%
.15%

Answer: 13.5% + 34% = 47.5%
30
70
75
80
85
65
60
55
34%
34%
13.5%
13.5%
2.35%
2.35%
.15%
.15%

Answer: .15%
31

24
28
32
36
20
16
12
Example 2 - Step 1 - Find mean and standard deviation and label the curve
32
24
28
32
36
20
16
12
34%
34%
13.5%
13.5%
2.35%
2.35%
.15%
.15%
Example 2 - Step 2 - Fill in percents
33
24
28
32
36
20
16
12
34%
34%
13.5%
13.5%
2.35%
2.35%
.15%
.15%
Answer: 13.5% + 34% + 34% + 13.5% = 95%

34
24
28
32
36
20
16
12
34%
34%
13.5%
13.5%
2.35%
2.35%
.15%
.15%
Answer: 2.35%

35
24
28
32
36
20
16
12
34%
34%
13.5%
13.5%
2.35%
2.35%
.15%
.15%
Answer: 13.5% + 2.35% = 15.85%

36
24
28
32
36
20
16
12
34%
34%
13.5%
13.5%
2.35%
2.35%
.15%
.15%
Answer: 34% + 13.5% + 2.35% + .15% = 50%

37
Complete the 6 questions
on DeltaMath to finish and
practice this material
Empirical Rule
(68-95-99.7 Rule)
You will be filling in your notes in your packet, so please have that out as you go through this powerpoint.
Show answer
Auto Play
Slide 1 / 37
SLIDE
Similar Resources on Wayground

32 questions
P6: Rational Expressions
Presentation
•
11th Grade
32 questions
Study Lesson For Finals + STAAR
Presentation
•
6th - 8th Grade
31 questions
2.2 Quadratic Functions
Presentation
•
11th Grade
31 questions
Lógica proposicional
Presentation
•
11th Grade
33 questions
Networks Definitions 3A recap
Presentation
•
11th Grade
34 questions
Graphs of Logarithmic Functions
Presentation
•
11th Grade
33 questions
The Coordinate Plane
Presentation
•
11th Grade
29 questions
Función exponencial
Presentation
•
11th Grade
Popular Resources on Wayground
10 questions
HCS SCI 03 Summer School Assessment 1
Quiz
•
3rd Grade
15 questions
HCS SCI 05 Summer School Assessment 1 Review
Quiz
•
5th Grade
22 questions
Day 9 Equations and Inequalities Review
Quiz
•
9th Grade
10 questions
Writing and Identifying Ratios Practice
Quiz
•
5th - 6th Grade
7 questions
PYRAMID PERSPECTIVES part 1
Presentation
•
9th - 12th Grade
12 questions
Understanding the Fourth of July
Quiz
•
9th Grade
15 questions
Soccer World Cup Quiz Questions
Quiz
•
7th Grade