Search Header Logo
  1. Resource Library
  2. Math
  3. Data And Graphing
  4. Analyzing Graphs
  5. Analyzing Graphs
Analyzing Graphs

Analyzing Graphs

Assessment

Presentation

Mathematics

6th - 11th Grade

Hard

Created by

James Gonzalez

FREE Resource

7 Slides • 22 Questions

1

Math 1: Analyzing Graphs

by Kaitlin Murphy

media

2

​Characteristics of Graphs

​All graphs are different!

​So, we have a lot of ways to describe what they look like and mean.

​This lesson will go over some of the vocab used to describe characteristics of graphs.

media

3

​y-intercept

The y-intercept is the place where the graph of the function crosses the y-axis.

​The function to the right has a

y-intercept of -6.

​Sometimes we use b as the variable for the y-intercept.

media
media

4

Multiple Choice

Question image

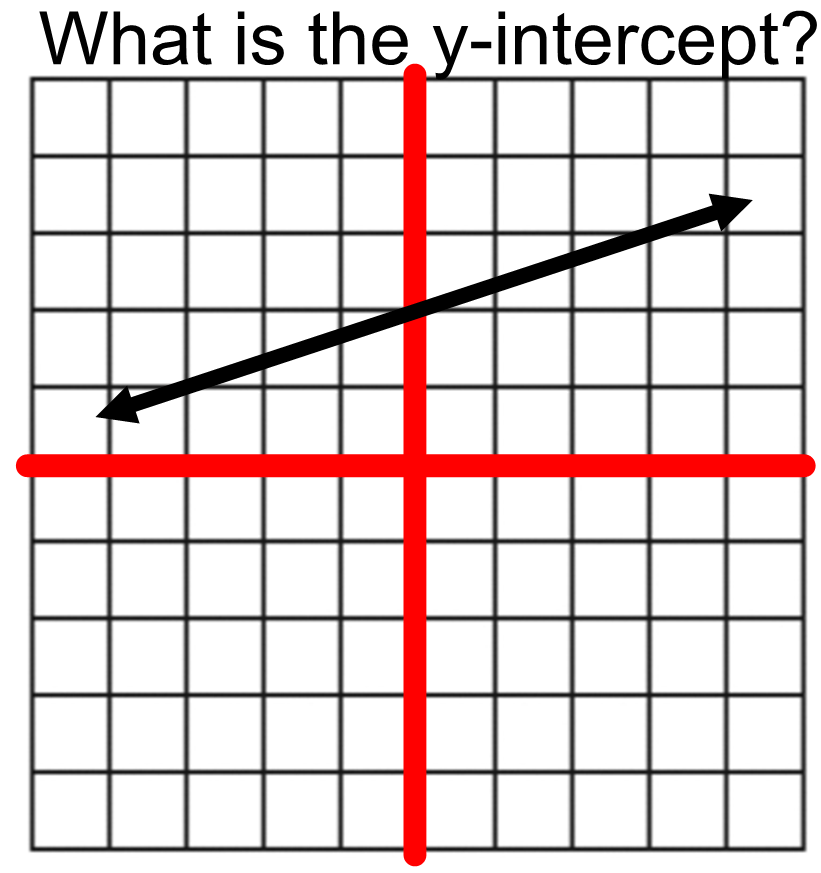
What is the y-intercept shown on the graph?

1

(0, -2)

2

(3, 0)

3

(0, 3)

4

None of these.

5

Multiple Choice

Question image
1

b=2

2

m=3

3

b=-3

4

m=-2

6

Fill in the Blank

Type answer...

7

​x-intercept(s)

An x-intercept is any place at which the graph of a function crosses the x-axis. It is possible for functions to have more than one x-intercepts (or zero!).

​The function to the right has three

x-intercepts at -3, -2, and 1.

​X-intercepts can also be called roots, solutions, or zeroes.

media
media
media
media

8

Fill in the Blank

Type answer...

9

Fill in the Blank

Type answer...

10

Multiple Choice

Question image

What are all the x-intercepts?

1

(-2.55, 0), (2.55, 0)

2

(-3,0), (-2,0), (2,0), (3,0)

3

(0, 36)

4

(-∞,∞)

11

Multiple Choice

Question image

Find the zeros.

1

x = 0 and 4

2

x = 0 and -4

3

x = 0

4

x = -4

12

Multiple Select

Question image

What are the zeros for the given polynomial? (Check all that apply)

HInt: where does the graph cross the X-axis

1

-4

2

-3

3

-2

4

-1

5

2

13

​Positive/Negative Intervals

It can be interesting to tell when a function is positive (above the x-axis) vs. when it is negative (below the x-axis). Remember to read the graph from left to right!

​The function to the right is negative on the intervals (-infinity, -3) and (-2,1).

​It is positive from (-3,-2) and (1, infinity).

media

14

Multiple Choice

Question image

Write the interval that represents the negative portion of the function?

1

(-2,1)

2

(-0.5,-3.5)

3

(,2); (1,)\left(-\infty,-2\right);\ \left(1,\infty\right)

4

(-3,0)

15

Multiple Choice

Question image

Where is the function positive?

1

(-∞,5]

2

(0, )\left(0,\ \infty\right)

3

(-∞,2]

4

(-∞,0)

16

Multiple Choice

Question image

Where is the function negative?

1

(-∞,1)

2

(-∞,∞)

3

(1,∞) and (-∞,1)

4

(-1,∞)

17

​Increasing/Decreasing Intervals

Besides positive and negative, it can be interesting to tell when a function is increasing vs. decreasing.

​The function to the right is increasing from (-infinity, -2.5ish) and (0, infinity).

​It is decreasing (sloping downward) from (-2.5, 0).

media

18

Multiple Choice

Question image

What is the increasing interval for the function below?

1

(,)\left(-\infty,\infty\right)

2

(,2]\left(-\infty,2\right]

3

(,6]\left(-\infty,6\right]

4

(6,6)\left(-6,6\right)

19

Multiple Choice

Question image

What is/are the increasing interval(s) for the function shown?

1

(3, 1)\left(-3,\ 1\right)

2

(4, 8)\left(4,\ 8\right)

3

(,1) and (3, 1)\left(-\infty,1\right)\ and\ \left(-3,\ 1\right)

20

Multiple Choice

Question image

What is the decreasing interval on the function shown?

1

(, 1)\left(-\infty,\ 1\right)

2

(, 2)\left(-\infty,\ 2\right)

3

(2, )\left(2,\ \infty\right)

4

(1, )\left(1,\ \infty\right)

21

Multiple Choice

Question image

How many increasing and decreasing intervals are there in this graph?

1

2 increasing, 2 decreasing

2

1 increasing, 2 decreasing

3

2 increasing, 1 decreasing

4

1 increasing, 1 decreasing

22

Multiple Choice

Question image

Over what interval is this function constant?

1

-5 < x < ∞

2

-3 < x < 4

3

4 < x < ∞

4

-5

23

maximum and minimum

Often we want to know when the graph reaches a maximum or minimum value.

​​The graph to the right has a local max at -2.5 with a value of about 1.

​​It also has a local minimum at 0 with a value of about -6.

​A global max/min would be the highest or lowest point of the entire graph. This graph does not have those since it keeps going down forever to the left and up forever to the right.

media
media
media

24

Multiple Choice

Question image

Does this graph have a minimum or maximum? What point?

1

minimum at (-3, -5)

2

minimum at (3, 5)

3

maximum at (-3, -5)

4

maximum at (3, 5)

25

Multiple Choice

Question image

Does this graph have a minimum or maximum? What point?

1

Minimum at (0, 0)

2

Minimum at (0, 2)

3

Maximum at (0, 0)

4

Maximum at (0, 2)

26

Multiple Choice

Question image

Which ordered pair identifies the *absolute minimum* point on this function?

1

(-1, 0)

2

(0, -3)

3

(1, -4)

4

(4, 0)

27

Multiple Choice

Question image

Which coordinate would qualify as the *absolute maximum* of this function?

1

2

(0, 4)

3

3

4

(4, 0)

28

Multiple Choice

Question image

What is the minimum value (y-values only)?

1

0

2

-5

3

-3

4

-1

29

Multiple Choice

Question image

What is the maximum value (y-value only)?

1

2

2

5

3

-1

4

0

Math 1: Analyzing Graphs

by Kaitlin Murphy

media

Show answer

Auto Play

Slide 1 / 29

SLIDE