Search Header Logo
  1. Resource Library
  2. Math
  3. Data And Graphing
  4. ...
  5. Pictographs
Pictographs

Pictographs

Assessment

Presentation

Mathematics

3rd Grade

Hard

Created by

Joseph Anderson

FREE Resource

12 Slides • 17 Questions

1

Pictographs

Understand the data shown by a picture graph. 

Explain how to use a key to read a picture graph. 

Use a picture graph to answer questions

media

2

But first, let's review....

3

Multiple Choice

Question image

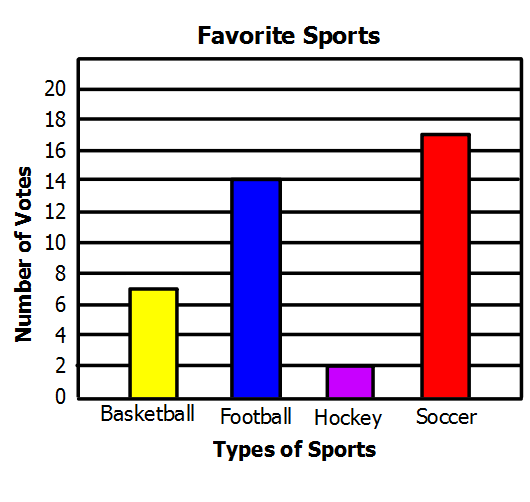
Look at the Bar Graph "Student Grades". Which grade did the smallest number of students get?

1

A

2

B

3

C

4

D

4

Multiple Choice

Question image

How many chickens does Nate have on his farm?

1

11

2

12

3

9

4

10

5

Multiple Choice

Question image
How many students voted for their favorite sport?
1
38
2
17
3
40
4
50

6

Multiple Choice

Question image
How many children like hamsters?
1
0
2
2
3
4
4
6

7

Multiple Choice

Question image
What number does this tally mark show?
1
100
2
50
3
500
4
150

8

media

9

media

10

Multiple Choice

What Are Pictographs?

1

It is a way of representing data through bars

2

It is a way of representing data through telly marks

3

A pictograph gives us information with certain pictures or symbols

4

All of the above

11

media

12

media

13

media

14

media

15

Multiple Choice

A pictograph must always have a _____

1

lines

2

key

3

bars

16

media

17

media

18

Multiple Choice

What does the key word "altogether" tell you to do?

1

add

2

subtract

3

multiply

4

divide

19

media

​How many birthdays are there in 4th grade all together?

20

Understand the data shown by a picture graph. 

Explain how to use a key to read a picture graph. 

Use a picture graph to answer questions

21

Fill in the Blank

Type answer...

22

Multiple Choice

Question image

Do 9 children have vanilla as their favourite?

1

Yes

2

No

23

Fill in the Blank

Type answer...

24

Multiple Choice

Question image
1

5 jumps

2

90 jumps

3

100 jumps

4

50 jumps

25

Multiple Choice

Question image

Moby collected seashells. How many pink AND black shells did he collect?

1

2 seashells

2

4 seashells

3

5 seashells

4

6 seashells

26

Multiple Choice

Where can you find what symbols mean on a pictograph?

1

in the key

2

in the title

3

in the survey

4

in the question

27

Multiple Choice

Pictographs, tally charts, and bar graphs all DISPLAY data. What does DISPLAY mean?

1

to write

2

to show

3

to find

4

to stop

28

Multiple Choice

In a pictograph, 1 star is equal to 2 votes. How many stars stand for 6 votes?

1
2
3
4

29

Multiple Choice

Question image

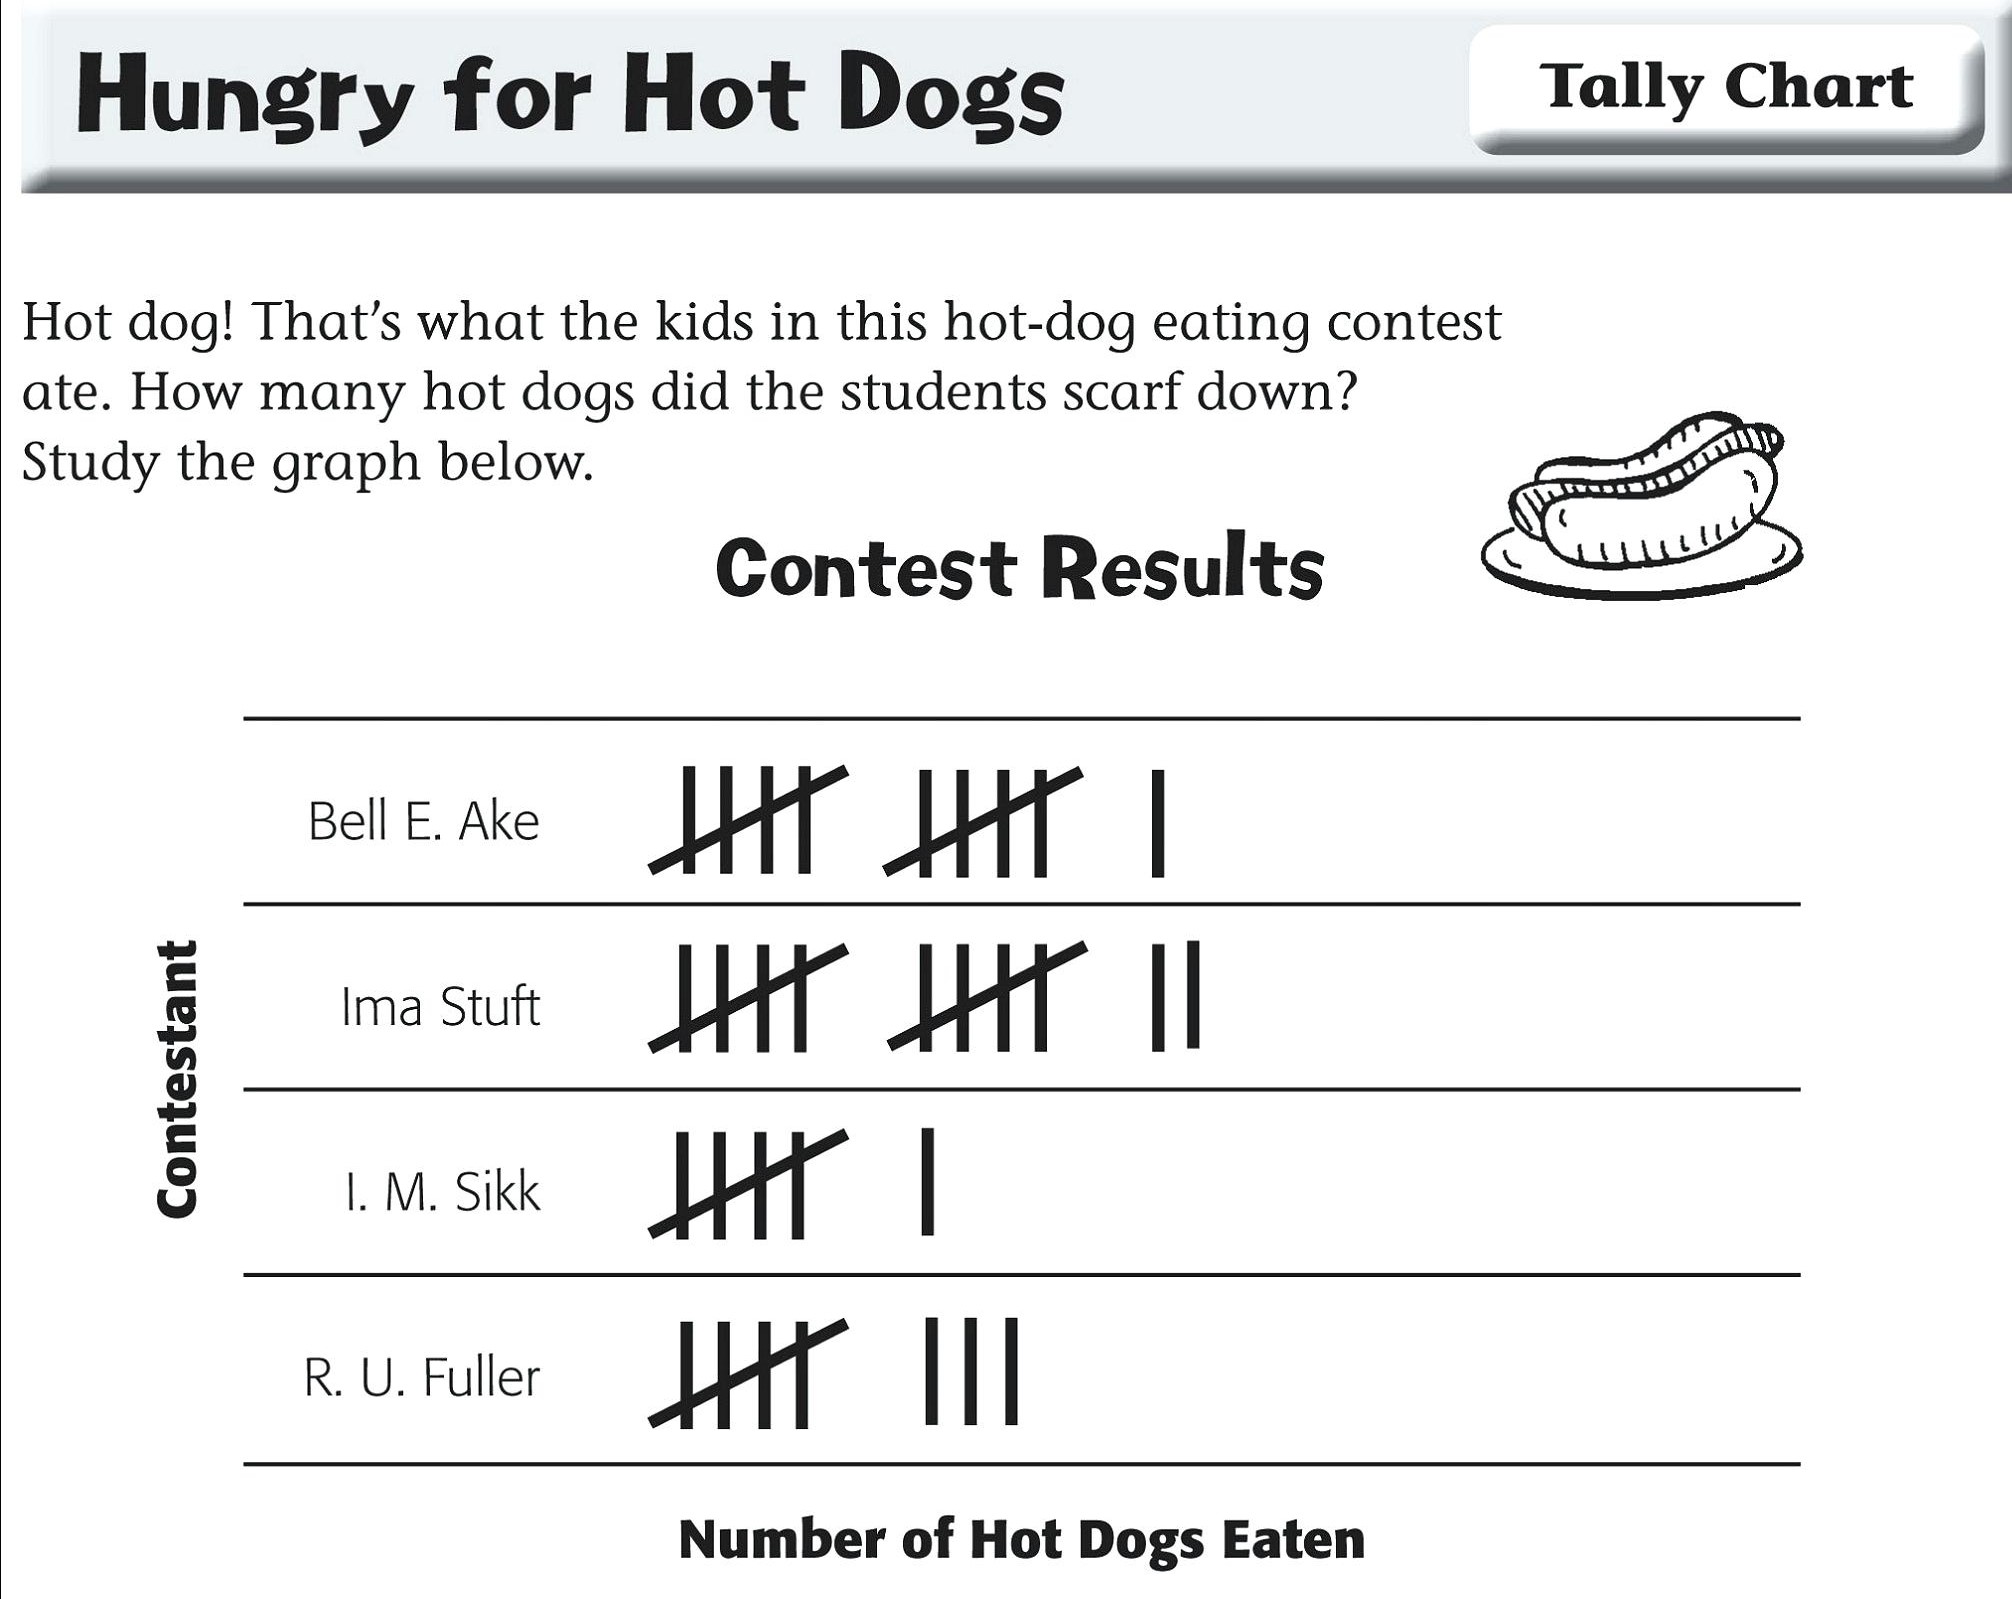
All together, how many hot dogs were eaten?

1

26

2

40

3

38

4

37

Pictographs

Understand the data shown by a picture graph. 

Explain how to use a key to read a picture graph. 

Use a picture graph to answer questions

media

Show answer

Auto Play

Slide 1 / 29

SLIDE