Average and Instantaneous Speed
Presentation
•
Science
•
6th Grade
•
Hard

Joseph Anderson
FREE Resource
22 Slides • 26 Questions
1
Average Speed
2
3
Look at these two cars. They both are going to travel a certain distance.
4
Fill in the Blanks
What distance are both cars going to travel?
Type answer...
5
Both cars are going to travel a total distance of 4 miles but they both may not reach the destination at the same time.
6
Multiple Choice
Why do both cars not reach the destination at the same time?
They are driving at different speeds
The cars are painted different colors
The drivers are listening to different music
Each car has a different number of cup holders
7
One driver may drive slower or faster than the other driver.
8
The drivers may not drive at the same speed throughout the entire 4 miles. Maybe one went 40 miles per hour for the first two miles then went 60 miles per hour for the last 2 miles.
9
A measurement of the average speed an object traveled takes into account all the variations in speed that may happen during a journey.
10
The higher an average speed number is, the faster that object completed its journey.
11
To calculate the average speed of an object you need to use the avearge speed formula.
12
The S stands for Average speed
The D stands for Distance
The T stands for Time
13
Multiple Choice
What does the S stand for in the average speed formula?
Average Speed
Distance
Time
14
Multiple Choice
What does the D stand for in the average speed formula?
Average Speed
Distance
Time
15
Multiple Choice
What does the T stand for in the average speed formula?
Average Speed
Distance
Time
16
To calculate the average speed of an object you need to DIVIDE the distance an object traveled by the time. The distance number goes in the calulator first.
17
Multiple Choice
What number do you put into the calculator first when calculating average speed?
Speed
Distance
Time
18
Multiple Choice
What do you have to do to the distance and time numbers?
Divide them
Multiply them
Subtract them
Add them
19
Use a calculator to help you! You need to score a 70 or above on this assignment to earn credit. You can take it as many times as you need to.
20
Fill in the Blanks
A dog ran 108 meters in 7.2 seconds. What is the dog's average speed? Remember to include the correct units after the number (m/s, km/h, mph)
Type answer...
21
Fill in the Blanks
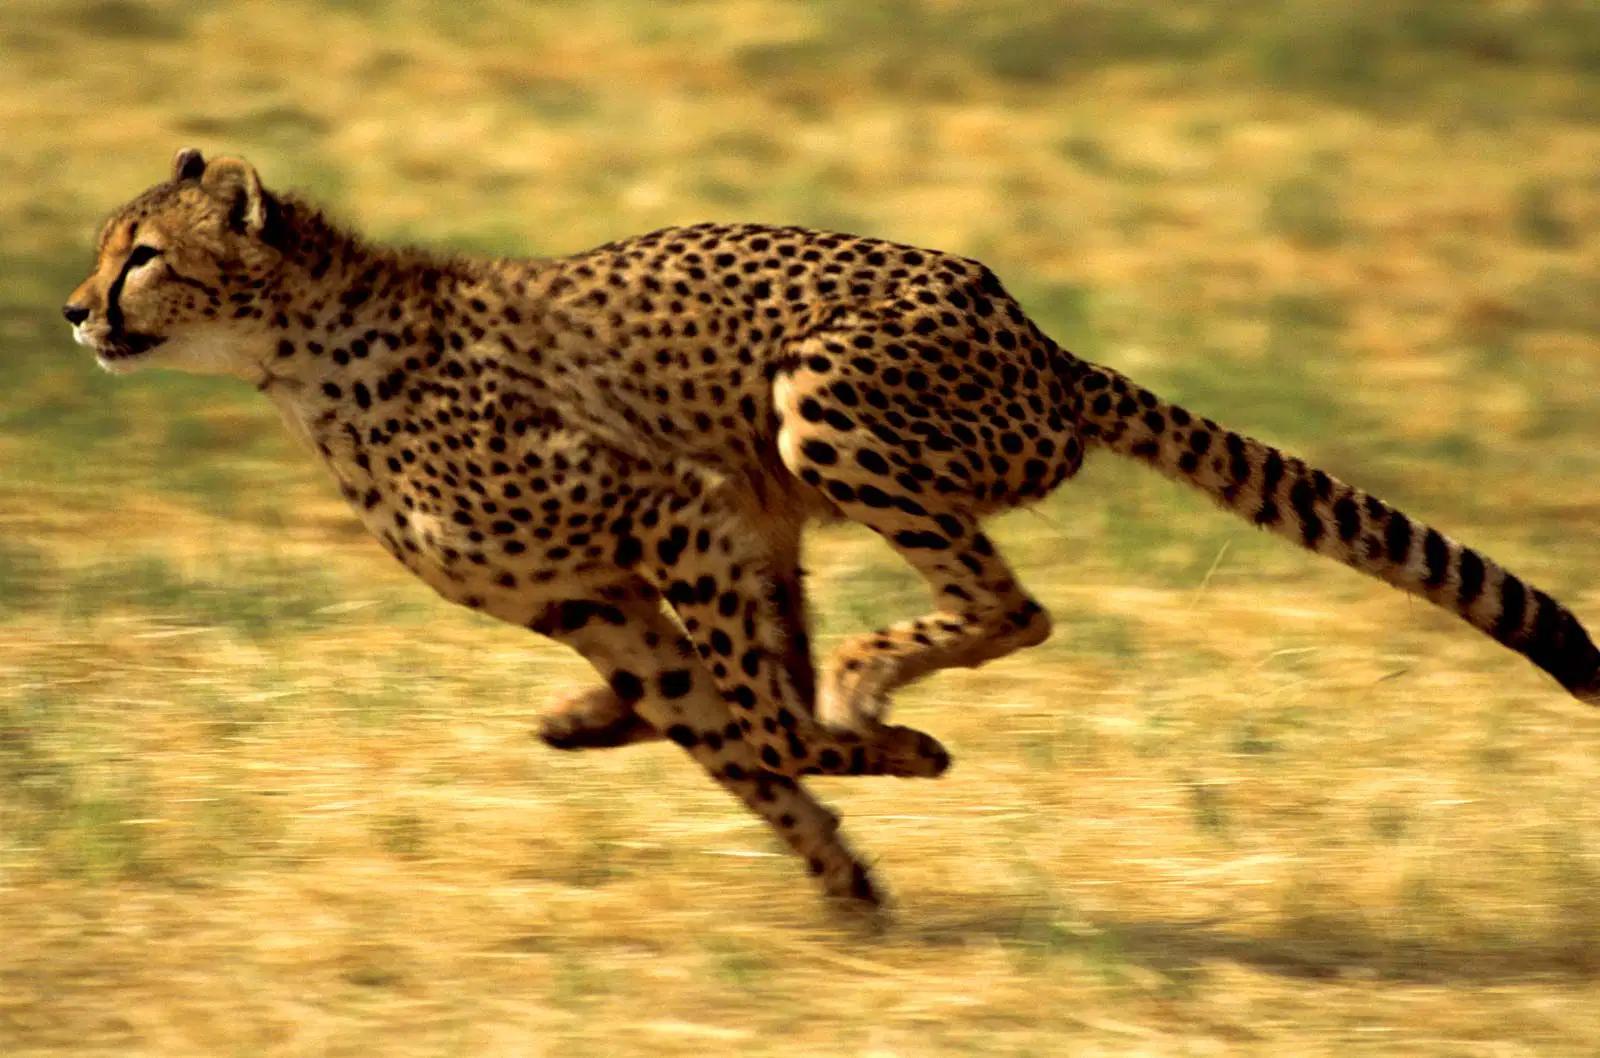
A cheetah ran 614.8 meters in 21.2 seconds. What is the cheetah's average speed? Remember to include the correct units after the number (m/s, km/h, mph)
22
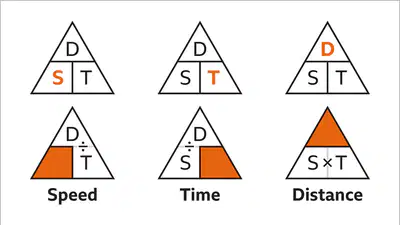
Use a calculator and the Speed Triangle to help you! You need to score a 70 or above on this assignment to earn credit. You can take it as many times as you need to.
23
Fill in the Blanks
A snail can move about 3 meters in 120 seconds. What is its average speed? Remember to include the correct units after the number (m/s, km/h, mph)
24
Fill in the Blanks
The Kawasaki H2R is the world's fastest motorcycle. If this motorcycle went at top speed (186 mph) for 4.5 hours how far would it go? Remember to include the correct units after the number (meters, kilometers, miles)
25
Fill in the Blanks
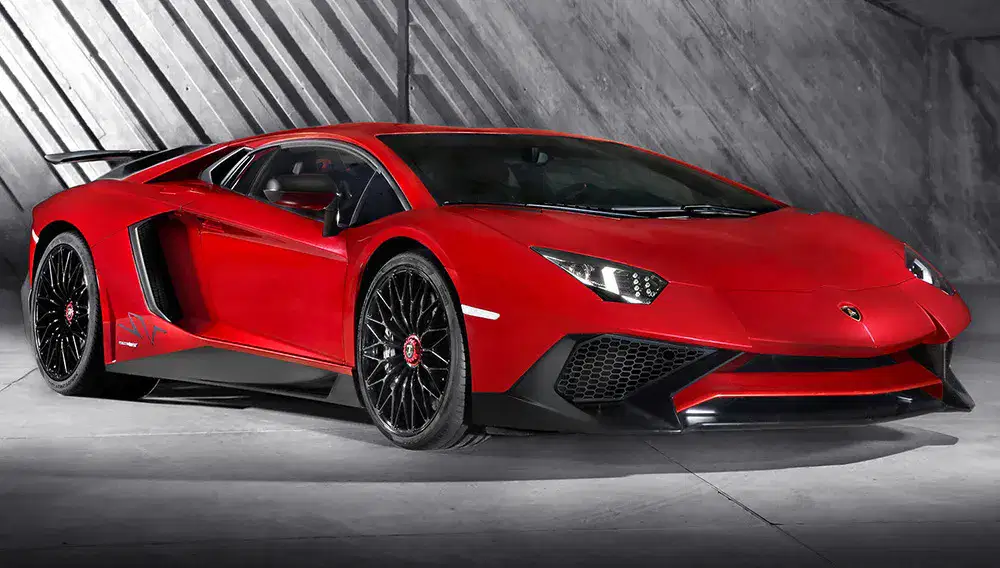
How much time would it take for the Lamborghini Veneno to drive 525 km at its top speed of 350 km/h? Remember to include the correct units after the number (seconds, minutes, hours)
26
Fill in the Blanks
A redwood tree can grow up to 46 cm per year (cm/yr). How tall would the tree be after 6 years? Remember to include the correct units after the number (m, cm, mm, inches, feet)
27
To calculate average speed you need to divide the distance by the time. You can get those numbers by looking at a graph.
28
Look at the graph and notice that distance numbers are found on the left side of the graph. The highest distance number is 70.
29
Fill in the Blanks
What is the highest distance number shown on the y-axis of the graph?
Type answer...
30
Look at the graph and notice that time numbers are found on the bottom of the graph. The highest time number is 7 seconds.
31
Fill in the Blanks
What is the highest time number shown on the graph?
Type answer...
32
Notice the red line went all the way up to 60 meters for distance. Put your finger at the top of the red line and move it over to the left and see that it lines up with 60 for distance.
33
Fill in the Blanks
What distance did the red line reach?
Type answer...
34
Notice the red line went out to 6 seconds. for time. Put your finger at the top of the red line and move it down and see that it lines up with 6 for time.
35
Fill in the Blanks
How many seconds did it take the red line to go a distance of 60 meters?
Type answer...
36
So the distance is: 60
The time is: 6
What is the average speed of the red line?
37
Fill in the Blanks
What is the average speed of the red line?
38
Fill in the Blanks
What is the average speed of the green line? Add only the first two digits after the decimal point.
39
Fill in the Blanks
What is the average speed of the blue line? Add only the first two digits after the decimal point.
40
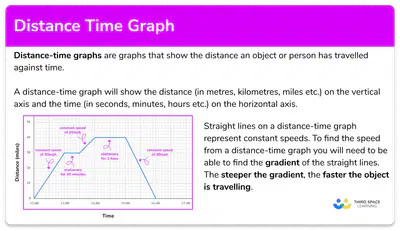
Read the information to the right about Distance vs. Time Graphs
41
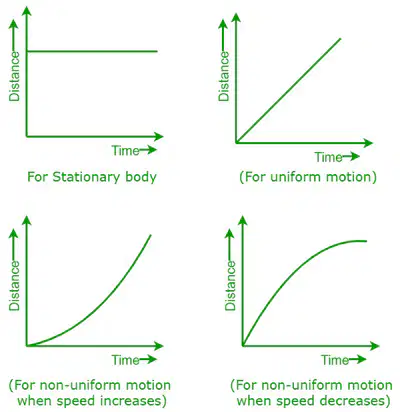
To the right are some examples of the types of lines you will see on a Distance-Time graph. Notice that uniform motion means the same thing as constant speed and stationary body means the same thing as at rest.
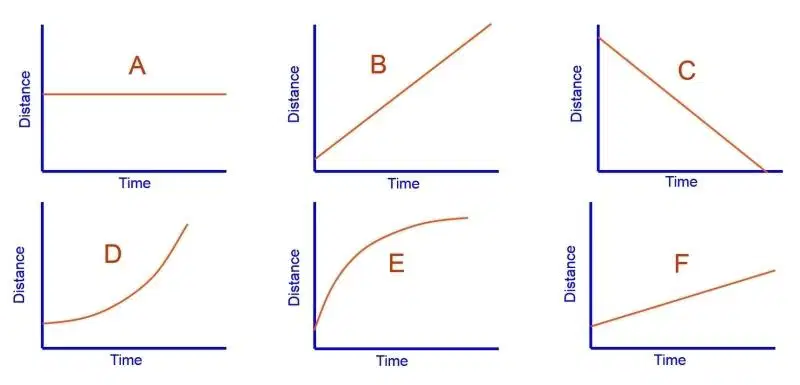
42
Multiple Choice
Which of the graphs in the picture shows an object + accelerating (you can use your ISN)?
D
A
B
E
43
Multiple Choice
Which of the graphs in the picture shows an object at rest/stationary (you can use your ISN)?
D
A
B
E
44
Multiple Choice
Which of the graphs in the picture shows an object decelerating (you can use your ISN)?
D
A
B
E
45
Multiple Choice
Which of the graphs in the picture shows an object with the slowest constant speed (you can use your ISN)?
C
A
B
F
46
Multiple Choice
In the graph shown which two letters show where the monster accelerated (you can use your ISN)?
C and H
B and G
D and C
A and F
47
Multiple Choice
In the graph shown which two letters show where the monster was at rest/stationary (you can use your ISN)?
C and H
B and G
D and C
A and F
48
Average Speed
Show answer
Auto Play
Slide 1 / 48
SLIDE

Similar Resources on Wayground
43 questions
Science Q4 S1 L4-5
Presentation
•
6th Grade
40 questions
Scientific Method
Presentation
•
7th Grade
45 questions
Protons, Neutrons, and Electrons - How they differ. Outline
Presentation
•
6th Grade
42 questions
Module F Unit 2 Lesson 1 - Earth's Oceans and the Ocean Floor
Presentation
•
6th Grade
39 questions
S6E5g
Presentation
•
6th Grade
46 questions
Heat Transfer Review 23-24
Presentation
•
6th Grade
44 questions
Microbiome Review
Presentation
•
6th Grade
41 questions
Air Quality & Air Pollution
Presentation
•
6th Grade
Popular Resources on Wayground
10 questions
Safety Day 2026 – Student Review
Quiz
•
9th Grade
21 questions
Continents and Oceans
Quiz
•
6th Grade
20 questions
Parts of Speech
Quiz
•
5th Grade
16 questions
Subject & Predicate
Quiz
•
5th Grade
25 questions
Multiplication Facts
Quiz
•
5th Grade
12 questions
Map Skills
Quiz
•
3rd Grade
22 questions
Continents and Oceans
Quiz
•
5th Grade
15 questions
Rounding Decimals
Quiz
•
5th Grade
Discover more resources for Science
20 questions
Elements, compounds, and mixtures
Quiz
•
6th Grade
10 questions
6.6D - Relative Density Review
Quiz
•
6th Grade
10 questions
Exploring Chemical and Physical Changes
Interactive video
•
6th - 10th Grade
20 questions
CONDUCTION,CONVECTION AND RADIATION
Quiz
•
6th Grade
20 questions
Rocks and The Rock Cycle
Quiz
•
6th Grade
19 questions
Describing and Classifying Matter
Presentation
•
6th Grade
21 questions
Waves and Wave Properties
Quiz
•
6th - 8th Grade
20 questions
Phases of the Moon
Quiz
•
6th Grade