Search Header Logo
Biology Graphing

Biology Graphing

Assessment

Presentation

Biology

9th - 12th Grade

Hard

Created by

Joseph Anderson

FREE Resource

5 Slides • 9 Questions

1

media

Unit 1
Graphs

2

media
media
media
media
media

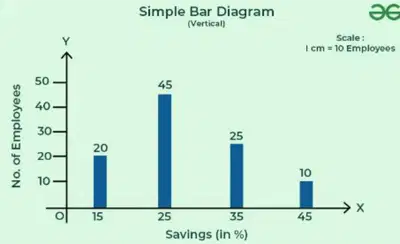
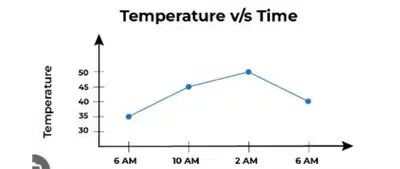
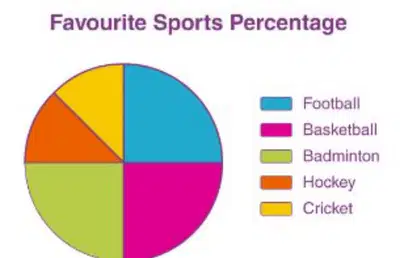
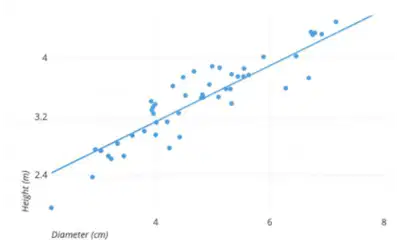
Graph: visually communicates data;
shows trends
Bar Graph

Line Graph

Pie Chart

Scatter Plot

3

media
media
media

How to make a graph:
1.

Independent variable goes on x axis (horizontal)/ Dependent variable goes on Y axis (vertical)

2. Write a title for:

The graph (at the top) and both X/Y axis

3. Plot your data points

*Make a legend if needed

4

Labelling

Label

Drag labels to their correct position on the image

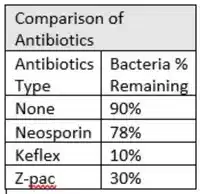
Comparison of Antibiotics

Antibiotics type

Bacteria Remaining

5

Draw

Plot the data on the graph using a bar graph. Note that you have to add scale to the graph (Remember: DRY MIX)

6

media
media
media

7

Categorize

Options (6)

Fertilizer type

Average plant height

Plant

Liquid amount

Temperature

Time

Question image

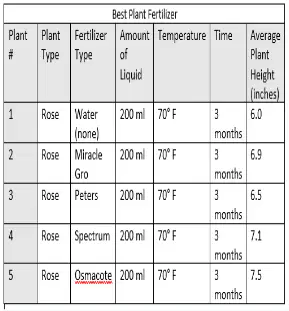
Organize these options into the right categories

Independent Variable
Dependent Variable
Constants

8

Multiple Choice
Question image

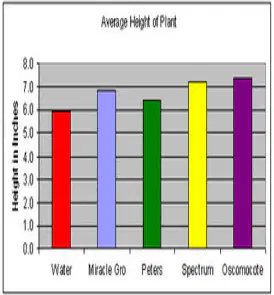
What is the Independent variable that is being tested?

1

Height of plant

2

Water

3

Types of Fertilizer

4

Amount of Sunlight

9

Multiple Choice

Question image

What is the Dependent variable that is being tested?

1

Height of plant

2

Water

3

Types of Fertilizer

4

Amount of Sunlight

10

media
media

11

Multiple Choice

Question image

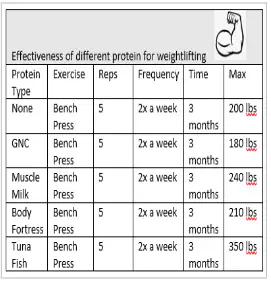
What is the scientific question from this data table?

1

What type of exercise is most effective for gaining muscle mass?

2

What type of protein is most effective for weightlifting?

3

What is the most effective amount of reps for weightlifting?

4

What frequency of using protein is most effective in gaining muscle?

12

Draw

Circle the control that this scientific study is using.

13

Categorize

Options (5)

Protein Type

Max

Exercise

Frequency

Time

Question image

Identify the different parts of the scientific investigation.

Independent Variable
Dependent Variable
Constants

14

Open Ended
Question image

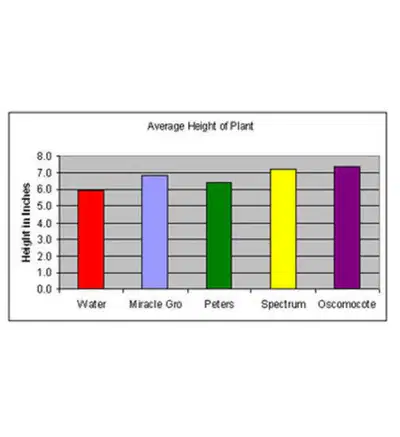
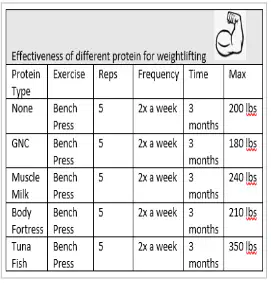
What conclusion can be made from the data?

media

Unit 1
Graphs

Show answer

Auto Play

Slide 1 / 14

SLIDE