
Line Plot and Stem and Leaf Plots
Presentation
•
Mathematics
•
8th Grade
•
Hard

Joseph Anderson
FREE Resource
3 Slides • 67 Questions
1
2
Multiple Choice

This is a;
3
Multiple Choice

This is a;
4
Multiple Choice

This is a;
5
Multiple Choice

This is a;
6
Multiple Choice
7
Multiple Choice
8
Multiple Choice
9
Multiple Choice
10
Multiple Choice
11
Multiple Choice
12
Multiple Choice
13
Multiple Choice
14
Multiple Choice
15
Multiple Choice
16
Multiple Choice
17
Multiple Choice
The mode(s) of this dot plot is(are);
18
Multiple Choice
The median of this dot plot is;
19
Multiple Choice
The range of this dot plot is;
20
Multiple Choice
The total number of items represented by this dot plot is;
21
Multiple Choice

The modal score according to this histogram is
22
Multiple Choice
The total number of students represented by this histogram is approximately
23
Multiple Choice
The total number of colors represented by this bar chart is;
24
Multiple Choice
The total number of children represented by this bar chart is approximately;
25
26
Multiple Choice
This is a stem & Leaf plot;
27
Multiple Choice

TRUE or FALSE? (you may use google)
A Stem and Leaf Plot is a table where each data value is split into a "stem" (the first digit(s) and a "leaf" (the last digit(s).
28
Multiple Choice

Textbook Page 79;
What is the most significant digit?
29
Multiple Choice
30
Multiple Choice
Textbook Page 79;
On a stem and leaf plot, the more significant digits (on the left) form the STEM
31
Multiple Choice
Textbook Page 79;
On a stem and leaf plot, the less/next significant digits (on the right) are displayed as the LEAVES
32
Multiple Choice

Who developed the stem and leaf?
33
Multiple Select
Why is it important to know / study stem and leaf plots? (2 answers)
34
Fill in the Blanks

35
Multiple Choice

Why do you need a key on a stem and leaf plot?
36
Multiple Choice

37
Multiple Select

What's wrong with this Stem & Leaf plot? (select 2 answers)
38
Multiple Choice

Which of these charts shows you all the data values in the data set?
39
Multiple Choice
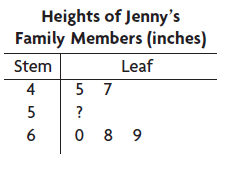
Jenny records the heights of her family members. The heights, in inches, are 50, 53, 45, 52, 68, 56 47, 69, and 60. The stem-and-leaf plot shows some of the data.
What are the leaves for stem 5?
40
Multiple Choice

The distances Clea biked weekly, in miles,
are 49, 31, 36, 41, 28, 44, 23, 34, 32, 33,
and 25. The stem-and-leaf plot shows some
of the data.
What are the leaves for stem 2?
41
Multiple Choice

Ted records the heights of the
sunflowers in his family’s garden. In
inches, the heights are 24, 11, 21, 18,
15, 25, 30, 13, 23, and 36. The stemand-
leaf plot shows some of the data.
What leaves should Ted write for
stem 1?
42
Multiple Choice

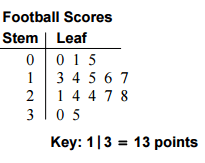
What is the minimum quiz score in this data set?
Hint; Combine the first value in the first stem with the first value in the leaf column.
43
Multiple Choice
What is the maximum quiz score in this data set?
Hint; Combine the first value in the last stem with the last value in the leaf column.
44
Multiple Choice
What is the range of the quiz scores in this data set?
Hint; Range = Maximum value - minimum value
45
Multiple Choice
How many students' scores are represented by this data set?
Hint; Count all the leaves in the stem & leaf plot
46
Multiple Choice

How many games did the team play?
Hint; Count all the leaves
47
Multiple Choice

This plot represent the number of cookies eaten at a county fair. What was the greatest amount of cookies eaten?
48
Multiple Choice

How many students scored more than 80%?
49
Multiple Choice

How many students got a perfect score on the test?
50
Multiple Choice
51
Multiple Choice

The graph above represents the results of a survey regarding the amount of Pokemon cards people own. Which statement could be true based on the data in the graph?
52
Multiple Choice

What is the Maximum data item on this stem and leaf plot?
53
Multiple Choice

What is the Mode of this data?
Hint; Mode is the number that appears the most. Look for the leaf that appears the most times, then combine it with its stem.
54
Multiple Choice

Find the mean?
Hint; Add all the values, divide by the total number of items.
55
Multiple Choice

Find the Median?
Hint; The diagram is already arranged in order, look for the leaf in the middle, then combine it with its stem.
56
Multiple Choice

What is the range?
Hint; Max - min
57
Multiple Choice

What is the Mode?
58
Multiple Choice

How does the median number of miles driven for Driver A compare to the median number of miles driven for Driver B?
59
Multiple Choice

60
Multiple Choice
61
Multiple Choice
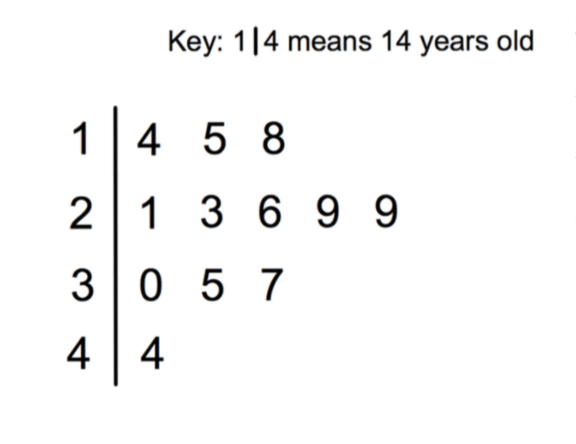
This stem and leaf diagram shows the ages of a group of people. How old is the youngest member of this group?
62
Multiple Choice

This stem and leaf diagram shows the ages of a group of people. How many people in this group are younger than 20?
63
Multiple Choice

This stem and leaf diagram shows the heights of Mrs Smith's flowers. How many flowers have a height of 14cm?
64
Multiple Choice

This stem and leaf diagram shows the marks achieved by students in Mrs Turner's class. How many girls are there in the class?
65
Multiple Choice

This stem and leaf diagram shows the marks achieved by students in Mrs Turner's class. What was the highest mark in the class?
66
Multiple Choice

This stem and leaf diagram shows the marks achieved by students in Mrs Turner's class. How many students got more than 24 marks?
67
Multiple Choice
What mistake has been made when making this stem and leaf diagram?
68
Multiple Choice
This stem and leaf diagram shows the marks achieved by students in Mrs. Turner's class. What is the difference between the modes of the two boys and girls?
69
Multiple Choice
This stem and leaf diagram shows the marks achieved by students in Mrs. Turner's class. What is the difference between the medians of the two boys & girls?
70
Show answer
Auto Play
Slide 1 / 70
SLIDE
