Search Header Logo
  1. Resource Library
  2. Social Studies
  3. Economics
  4. Production Possibilities Curve
  5. 1.4 Oppurtunity Cost And Production Possibilities Curve
1.4 Oppurtunity Cost and Production Possibilities Curve

1.4 Oppurtunity Cost and Production Possibilities Curve

Assessment

Presentation

•

Social Studies

•

9th - 12th Grade

•

Medium

Created by

Marlee McNamee

Used 4+ times

FREE Resource

17 Slides • 15 Questions

1

media

2

media

3

media

4

Multiple Choice

What are trade-offs in decision making?

1

Alternatives given up when choosing one option over another

2

The benefits of a chosen option

3

The costs associated with a decision

4

The final outcome of a decision

5

media

6

media

7

Multiple Choice

What is opportunity cost?
1
your choice
2

The most desirable alternative you give up when making making a choice

3

All of the alternatives you give up when making a choice

4

All the benefits you get from the choice you made

8

Multiple Choice

Max is studying for his spelling test.  Unfortunately, his favorite TV program is on right now.  If he studies for the test, he will miss watching the show.  Max decides to study for his test instead of watching TV.  What is the opportunity cost of his decision?
1
studying for a test
2
watching TV 
3

time with his friends

4

a good grade on the test

9

media

10

media

11

Multiple Choice

What does the Production Possibilities Curve (PPC) illustrate?

1

The relationship between supply and demand

2

The opportunity cost of decisions

3

The total production of a single good

4

The effects of inflation on prices

12

media

13

Multiple Select

What are the key assumptions regarding the production of goods?

1

Only one good can be produced

2

All resources are being used efficiently

3

All resources are fixed

4

Only two goods can be produced

14

media

15

Multiple Choice

What does it mean when a point is located on the curve in a production possibilities graph?

1

It represents inefficiency

2

It indicates unemployment

3

It shows efficient use of resources

4

It signifies impossible production

16

Multiple Choice

What does each point on the Production Possibilities Table represent?

1

A random selection of goods

2

A specific combination of goods produced with full employment of resources

3

A surplus of goods

4

A deficit of resources

17

Multiple Choice

What does a point inside the Production Possibility Curve (PPC) indicate?

1

Efficiency

2

Inefficiency/Unemployment

3

Maximum production

4

Economic growth

18

Multiple Choice

Which point on the PPC represents an unattainable production level given current resources?

1

A point inside the PPC

2

A point on the PPC

3

A point outside the PPC

4

A point at the origin

19

media

20

media

21

Multiple Choice

Question image
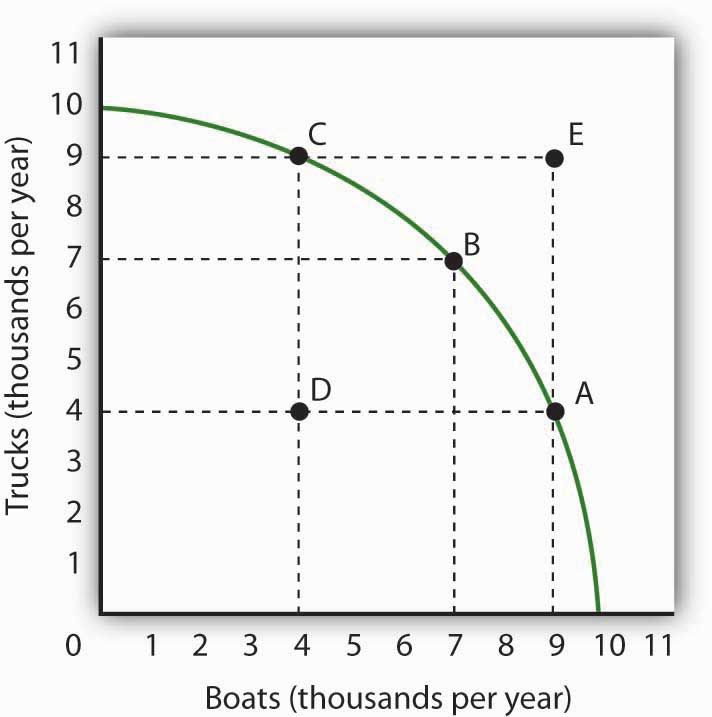
The opportunity cost of increasing production from 7 to 9 trucks is
1
Scarcity
2
2 boats
3
2 trucks
4
3 boats

22

Multiple Choice

Question image
The opportunity cost of increasing production from 4 to 7 boats is
1
1 boat
2
2 boats
3
2 trucks
4
3 trucks

23

media

24

media

25

Multiple Select

Which are the three shifters of the PPC?

1

Changes in resources

2

Shifts in productivity

3

Economic growth or decline

4

Change in demand

26

media

27

media

28

Multiple Choice

What factors contribute to economic growth?

1

New Tech

2

War

3

Natural Disaster

4

Virus

29

Multiple Choice

What would cause an OUTWARD shift in a production possibility curve?

1

A decrease in technological advancements

2

An increase in the labor force

3

A decrease in the availability of resources

4

Decreased availability of skilled laborAn increase in government regulations

30

media

31

media

32

Multiple Choice

If the opportunity costs of production are constant, then the production possibility curve is:

1

bowed out from the origin.

2

bowed in toward the origin.

3

a straight line.

4

circular.

media

Show answer

Auto Play

Slide 1 / 32

SLIDE