
AP Bio Lesson 0 Scientific Method and Experimental Design
Presentation
•
Biology
•
9th - 12th Grade
•
Medium
+10
Standards-aligned

James Franks
Used 1+ times
FREE Resource
29 Slides • 44 Questions
1
AP Biology Lesson 0
Scientific Method and Experimental Design
2
LO: Review the basic concepts of the scientific method and experimental design:
Identify or pose a testable question based on an observation, data, or a model.
State the null and alternative hypotheses, or predict the results of an experiment.
Identify experimental procedures that are aligned to the question, including:
Identifying dependent and independent variables.
Identifying appropriate controls.
Justifying appropriate controls.
Support a claim with evidence from biological
principles, concepts, processes, and/or data.
Provide reasoning to justify a claim by connecting evidence to biological theories.
Explain the relationship between experimental results and larger biological concepts, processes, or theories.
Construct a graph, plot, or chart.
Describe data from a table or graph, including: Identifying specific data points; Describing trends and/or patterns in the data.
c. Describing relationships between variables.
3
Four Big Ideas of AP Biology:
Big Idea 1: Evolution- the process of evolution drives the diversity and unity of life
Big Idea 2: Energetics- Biological systems use energy and molecular building blocks to grow, reproduce, and maintain dynamic homeostasis.
Big Idea 3: Information storage and transmission- living systems store, retrieve, transmit, and respond to information essential to life processes.
Big Idea 4: Systems interactions- Biological systems interact, and these systems and their interactions exhibit complex properties.
4
The Four Big Ideas are Interleaved into 8 Units and are Separated into:
Learning objectives (LO): define what a student needs to be able to do with the content knowledge in order to progress through the course
Essential knowledge (EK): describe the knowledge required to perform the learning objective
5
AP Biology Science Practices include:
Concept explanation
Analyze visual representations
Determine scientific questions and methods
Represent and describe data
Perform statistical tests and data analysis
Develop and justify scientific arguments using evidence
6
Scientific method: a step-by-step process used by scientists to investigate questions, gather evidence, and draw conclusions based on experiments and observations.

7
Make an Observation
Ex: monarch butterflies can sometimes be found flying at night near very bright, artificial sources of light (like streetlights).
Ask Questions
Can this be manipulated and turned into a repeatable experiment?
Research the Topic:
Monarch butterflies are diurnal (active/flying during the day; resting/not flying at night)
Circadian rhythm (internal clock tracks day/night)
Migratory (use sunlight as a compass; antennae help track the sun during flight)
Proteins important for flight are processed at night while the butterfly rests
8
Form Hypotheses:
Hypothesis: a testable explanation for an observation
A hypothesis must be testable!
Explains the relationship between variables and what the researcher expects to happen to one variable if another variable changes
“If … , then … (because…)” but it does not need to be in this format
“If”- the independent variable
“Then”- the dependent variable
“Because” - optional explanation
Results either support or do not support/refute the hypothesis
NEVER SAY, “The hypothesis is correct”
9
Multiple Choice
A student notices that water striders can walk on the surface of a pond but sink when a small amount of soap is added to the water. She wants to investigate why this happens. According to the general steps of the scientific method, what should be her immediate next step after making this observation and asking a question?
Conduct a controlled experiment with varying amounts of soap.
Analyze data from similar experiments published in scientific journals.
Formulate a testable hypothesis regarding the effect of soap on the surface tension of water.
Draw a conclusion that soap disrupts hydrogen bonds between water molecules.
10
Multiple Choice
Which of the following represents a properly formulated hypothesis for an investigation into the effect of temperature on the rate of an enzyme-catalyzed reaction?
Enzymes work best at 37C because that is human body temperature.
If the temperature increases to 60C, then the rate of the reaction will decrease because the enzyme will denature.
The rate of reaction is dependent on the temperature of the solution.
Does increasing the temperature affect the amount of product produced?
11
Hypothesis tests: statistical test procedures to test hypotheses about a population based on a sample
Helps to determine if observed differences between groups are statistically significant or due to chance
Null hypothesis (H0)
Hypothesis that there is no effect or no difference between the two groups of data
Observations are the result of chance
Alternative hypothesis (Ha: H1, H2…etc.)
Hypothesis that there IS a relationship/ effect/ difference between the two groups of data
Observations are due to a nonrandom cause - not by chance
12
Why do we need a null for hypothesis testing?
Provides a baseline, which we can use to compare our sample results to
Allows for a hypothesis to be tested in a meaningful way using statistical tests.
Use the data to determine if there is strong enough evidence to reject the null hypothesis, meaning the alternative hypothesis may be supported by the data
13
When to use Statistical Tests
Standard Deviation - Use this when you simply need to describe the variability or spread of your data set.
Low SD: Data points are close to the mean (consistent data).
High SD: Data points are spread out (inconsistent data).
You rarely use this to argue "significance" on its own. It is mostly a descriptive stat.
Standard Error of the Mean (SEM) & Error Bars
Use this when you need to determine if two groups are statistically different from each other (e.g., Did the fertilizer actually make the plants grow taller, or was it just chance?).
You will calculate 2 x SEM (2 Standard Errors) to create 95% Confidence Interval error bars on a graph.
14
When to use Statistical Tests
Chi-Square Goodness of Fit - Use this when you have categories (counts) and a theoretical prediction (like a Punnett Square or specific ratio).
Example: Genetics (3:1 ratio), Animal Behavior (do pillbugs prefer wet or dry sides?), Hardy-Weinberg predictions.
tells you if your real-world data ("Observed") matches your prediction ("Expected").
Interpreting the Result: X2 < Critical Value: Fail to reject the Null. (Data matches the prediction; differences are just chance). x2 > Critical Value: Reject the Null. (Data does NOT match the prediction; something else is going on).
15
Dropdown
Does ivy grow better in areas with more sun versus in shady areas?
16
Multiple Choice
Researchers are testing a new fertilizer to see if it increases the growth rate of corn plants compared to a standard fertilizer.
Which of the following best represents the null hypothesis (H0) for this experiment?
The new fertilizer will result in a statistically significant increase in plant growth compared to the standard fertilizer.
There will be no statistical difference in the growth rate of corn plants treated with the new fertilizer versus the standard fertilizer.
If the new fertilizer is used, the plants will grow taller because of the added nitrogen.
The new fertilizer will decrease plant growth due to nutrient burn.
17
Open Ended
Determine a suitable null hypothesis for the monarch butterfly experiment:
How does exposure to artificial light at night affect the number of monarch butterflies that initiate flight?
18
Performing Experiments: Groups
Need at least 3 Groups
Control Group: Used for comparison to the experimental group; help to validate statistical analysis and increase confidence in conclusions drawn from the experimental results; does not receive the independent variable (IV)
Experimental Groups: Receives the experimental treatment (IV) being tested to observe its impact on the outcome (DV)
19
Kinds of Control Groups:
Negative Control: Group NOT exposed to any treatment OR exposed to a treatment known to have NO effect
Helps to ensure there is NO effect when there should be NO effect
Positive Control: Group not exposed to the IV but IS exposed to a treatment known to HAVE an expected effect
Ensures the experimental setup can produce a known effect; provides a reference point for what a known effect looks like
20
Example Negative Control
A researcher wants to test the effect of caffeine on heart rate
Researcher will give negative control group a treatment that is known to have no effect on heart rate
Water is known to have no effect on heart rate with consumption
If the water affects heart rate in the negative control group then there must be another variable affecting heart rate or the water is contaminated
21
Example Positive Control:
A researcher wants to test the effect of a new antibiotic on a strain of bacteria
How would the researcher know the new antibiotic (experimental group) is actually effective?
Use an established antibiotic that is known to work (positive control group)
If the experimental groups fail, but the positive control is successful, it is likely that the tested antibiotics are ineffective.

22
Dropdown
A placebo pill that has no effect is a
A drug known to reduce blood pressure is a
23
Dropdown
An energy drink is a
Water is a
24
Dropdown
25
Multiple Choice
A student is performing a Benedict’s test to detect the presence of reducing sugars in a food sample. They want to ensure their Benedict's reagent is working correctly and that their water source is not contaminated.
>Tube A: Contains distilled water + Benedict’s reagent.
>Tube B: Contains a glucose solution + Benedict’s reagent.
Which statement correctly identifies the controls?
Tube A is the positive control; Tube B is the negative control.
Tube A is the negative control; Tube B is the positive control.
Both tubes are negative controls.
Both tubes are positive controls.
26
Performing Experiments: Variables
Independent: The one factor that is changed between groups; what is being manipulated; graphed on the x-axis
Dependent: Factor that is measured and affected by the IV; graphed on the y-axis
Constant: Factors kept consistent for all groups to ensure only the IV affects the outcome; aka controlled variables
27
Multiple Choice

Identify the dependent variable according to this graph.
Seed Type
Number of Bird Species
Sunflower and Sorghum
Sunflower
28
Dropdown
The number of cars washed is the
The amount of money made is the
29
Dropdown
Heart rate is the
Exposure to physical stress is the
30
Dropdown
The temperature of the water is the
How fast the fish can swim is the
31
Multiple Choice
In an experiment testing the effect of pH on the function of the enzyme amylase, researchers ensure that the temperature, substrate concentration, and volume of the solution are identical in all test tubes.
These variables are best described as:
Controls
Dependent variables
Constants
Negative controls
32
Multiple Choice
A scientist is studying how the concentration of substrate affects the initial rate of a reaction catalyzed by the enzyme catalase.
When graphing the results of this experiment, how should the variables be plotted?
Substrate concentration on the x-axis; Reaction rate on the y-axis.
Reaction rate on the x-axis; Substrate concentration on the y-axis.
Time on the x-axis; Substrate concentration on the y-axis.
Enzyme concentration on the x-axis; Reaction rate on the y-axis.
33
PRACTICE QUESTIONS
34
Match
Match the scientific method
Sensing the world, and noticing patterns and relationships
This stage involves making an educated guess that includes a prediction,
This phase involves a structured form of observation that allows you to examine one thing at a time.
This last stage involves answering questions such as 1) Was the hypothesis correct? 2) Are there other lines of evidence that point in the same direction?
Making observations
Formulating hypothesis
Performing experiments
Drawing conclusions
Making observations
Formulating hypothesis
Performing experiments
Drawing conclusions
35
Multiple Choice
The alternative hypothesis usually states that there is no difference between the groups of data and, if there is a difference, it is due to chance.
TRUE
FALSE
36
Match
Match the following parts of the experiment: Sophia became interested in insulation while her parent’s new house was being built. She decided to determine which insulation transferred the least amount of heat. She filled each of 5 jars half-full with water. She sealed each jar with a plastic lid. Then she wrapped 4 of the jars with a different kind of insulation, leaving one jar without insulation. She put the jars outside in the direct sunlight. Later, she measured the temperature of the water in each jar.
Control Group
Experimental Group
Independent Variable
Dependent Variable
Constant
Jar with no insulation.
Jars with insulation
Type of insulation
Temperature of water
How much water
Jar with no insulation.
Jars with insulation
Type of insulation
Temperature of water
How much water
37
Multiple Choice
38
Multiple Choice
Students put two plants in the sun.
Plant A is in the sun for 10 minutes. Plant B is in the sun for 1 hr.
Students decide that plant B is better at photosynthesis. This is wrong because...
39
Multiple Choice
How could this experiment be improved?
40
Multiple Select
Which of these describes the control group? (Select two)
The group that receives no independent variable or the normal version of the independent variable.
The group that receives no dependent variable or the normal version of the dependent variable.
The purpose is to provide a group to compare to the experimental groups.
The purpose is to collect more data about the independent variable to increase validity.
41
Graphing
&
Descriptive Statistics
42

Graphing Requirements
A good title (Y vs. X of _____)
Label your axes with units, and use evenly spaced and scaled numbers to spread out the data.
Clearly mark data points.
When making a line graph, draw a line of best fit
Any extrapolation beyond the last data point should be shown with a dashed line.
43
Bar Graphs
Used for categorical independent variables (distinct groups like "Control," "Treatment A," "Treatment B").
X-axis: Categories (Words/Labels, not continuous numbers).
Y-axis: Dependent Variable (Numerical data).
The Bar Height: Represents the MEAN (Average) of the data for that group.
Error Bars must be included to show the variability of the data.
Rule: If error bars overlap, there is likely no significant difference. If they do not overlap, the difference is likely statistically significant.

44
Box & Whisker Plots
A data visualization that displays the distribution of data based on:
Minimum: lowest data point (excluding outliers).
Q1 : The median of the lower half of the data.
Median (Q2): The middle value (the line inside the box). Crucial Distinction: This is not the mean.
Q3 : The median of the upper half of the data.
Maximum: The highest data point (excluding outliers).
Use to see the spread and skew of the data.
Use to identify outliers (points that fall way outside the whiskers).


45
Line Graph
Continuous Independent Variables.
Used when the X-axis is numerical and continuous (e.g., Time, Temperature, pH, Concentration).
Might have two y-axes for multiple scales - rarely have to graph these but often appear in the Multiple Choice section
Plot the mean at each time point and include error bars (2SEM) to show significance changes over time
Might have a log scale used for exponential data that spans several orders of magnitude, such as bacterial growth curves or DNA fragment sizes (semi-log plots).
Most common reason to use a line graph in AP Bio is to calculate a rate (Change in Y / Change in X).


46
Data Tables
Title must be descriptive (e.g., "Table 1: The Effect of [Independent Variable] on [Dependent Variable]").
Units must be included in the headers (e.g., "Time (min)" or "Mass (g)"), not written next to every single number in the cells.
Use Standard Convention: Independent Variable (IV) on the Left (First Column). Dependent Variable (DV) on the Right.
Data in a column should have the same number of decimal places (sig figs) to show consistent precision.
Use a Ruler - if the reader cannot tell which row a number belongs to, they cannot award points


47
Descriptive Statistics
Calculate descriptive statistics for each group
control and experimental
Mean = average of the data set
Median = he middle value when data is ordered
Useful when data has outliers (extreme values) that might skew the mean
Mode = the number that appears most frequently
Range = the difference between smallest and largest values
This gives a quick sense of the spread but is sensitive to outliers.
Standard Deviation = variability (spread) from the mean
Standard Error of the Mean = measure of the precision of the sample mean
estimates how far your sample mean is likely to be from the true population mean.

48
Multiple Choice
49
Multiple Choice
The average of the data set
Mean
Median
Mode
Range
50
Fill in the Blanks

Type answer...
51
Multiple Choice
The difference between the largest and smallest values.
Mean
Range
Standard Deviation
Variability
52
Multiple Choice
The value that appears most often in a data set.
Mean
Median
Mode
Range
53
Standard Deviation
Measures how spread out the data points are from the mean
Low s= Data is clustered closely to the mean (Narrow Curve)
High s = Data is spread far from the mean (Wide Curve)
68% of data is within 1 standard deviation
95% of data is within 2 standard deviations
99.7% of data is within 3 standard deviations


54
Multiple Choice
A measure of how spread out the data is from the mean.
Variability
Standard deviation
Range
Mean
55
Multiple Choice
Set 1-Standard Deviation=3.1
Set 2-Standard Deviation=4.9
Set 3-Standard Deviation=1.7
Set 4-Standard Deviation=3.2
Which set of data probably has the points closest to the mean?
56
Labelling
Label the graphs as low and high standard deviation.
High
Low
57
Standard Error of the Mean
How confident you are that your sample mean includes the population mean.
Use +/- 2SEM error bars to create a 95% Confidence Interval - we are 95% confident the true population mean lies within this range.
The larger the error bar, the less confident we are that the calculated mean is representative of the entire population.
As sample size (n) gets larger, Standard Error gets smaller (your data becomes more precise).
If the error bars of two groups overlap, there is no statistical difference between them (accept Null)
If the error bars do not overlap, there is a statistically significant difference between the groups (fail to accept Null)


58
Multiple Choice
Used to determine the precision and confidence in the mean value and usually given as +/- 2 SE (How well does the mean sample represent the true mean of the population)
Standard Error of the Mean
Mean
Standard Deviation
Range
59
Multiple Choice
Low standard error equals _____ in confidence
Decrease
Increase
60
Multiple Choice
Standard error can be graphed as _____.
Error Bars
Bar Graph
Standard Deviation Bars
Line Graph
61
Multiple Choice
If error bars overlap, the difference _____ significant.
is Not
May Be
62
Multiple Choice
If error bars do not overlap, the difference _____ significant.
Not
May Be
63
Multiple Choice

True or false: Oranges are more expensive compared to apples.
True, the average is higher (the bar graph)
True, the error bars overlap, therefore, there is a significant difference.
False, the error bars overlap, therefore there is NO significant difference. The variation is due to chance.
64
Fill in the Blanks

Type answer...
65
Multiple Choice

The differences in the graph:
are not significant
are significant
66
Multiple Choice

Which of the following is a correct conclusion to draw from this graph?
Exercise increases blood plasma prolactin
Exercise has a significant impact on blood plasma prolactin
Exercise has no significant impact on blood plasma prolactin
67
Multiple Choice

Which group had a significant decrease in reaction time after the treatment?
A
B
A & B
C
68
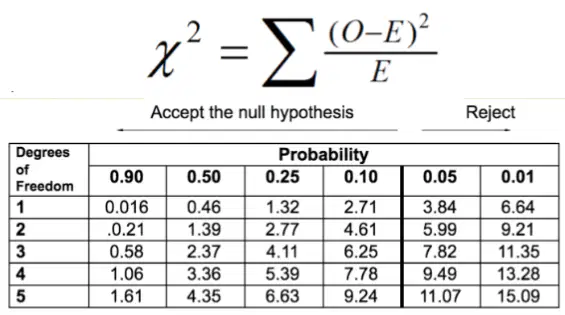
Chi-square Goodness of Fit (GOF) = Observed vs Expected
Use when you are comparing one (observed) data set to predicted (expected) values.
The coin flip example.
1:2:1 ratios of progeny – think Punnett squares!
Evaluating whether organisms are attracted or repelled by something in their environment.
Does this population meet the predictions of the Hardy-Weinberg equilibrium?
Null: There is no difference between the expected and observed data.
Alternate: There is a difference between the expected and observed data.
Assume p=0.05
Reject Null Hypothesis if X2 > Critical Value
Fail to reject the Null Hypothesis if X2 is < Critical Value


69
Multiple Choice
Degrees of freedom is calculated by
dividing the standard deviation by the square root of the sample size
subtracting one from the sample size
adding together all values and dividing by the sample size
squaring the difference between the observed and expected values
70
Multiple Choice
IF I flip a coin 250 times and I only get 107 tails, can I accept my null hypothesis that nothing is wrong with my coin - all due to chance?
Fail to Reject the null hypothesis, the Chi Square value is greater than the critical value
Reject the null hypothesis, the Chi Square value is greater than the critical value
Fail to Reject the null hypothesis, the Chi Square value is less than the critical value
Reject the null hypothesis, the Chi Square value is less than the critical value
71
Practice Questions
72
Fill in the Blanks
Type answer...
73
Multiple Choice
The data sets show the test scores of a group for the last two tests.
Test 1: {75, 75, 85, 80, 65, 70, 65} Test 2: {95, 85, 85, 90, 90, 95, 100}
Which data set had the SMALLER standard deviation?
Test 1 with a standard deviation of 6.9
Test 2 with a standard deviation of 6.9
Test 1 with a standard deviation of 5.2
Test 2 with a standard deviation of 5.6
AP Biology Lesson 0
Scientific Method and Experimental Design
Show answer
Auto Play
Slide 1 / 73
SLIDE
Similar Resources on Wayground

69 questions
Ch. 5 Electrons in Atoms
Presentation
•
9th - 12th Grade
69 questions
Les articles français
Presentation
•
9th - 12th Grade
65 questions
AP Biology Unit 7: Natural Selection Review
Presentation
•
9th - 12th Grade
66 questions
Briggs 12B Plant Systems
Presentation
•
9th Grade - University
71 questions
Endocrine system
Presentation
•
10th - 12th Grade
70 questions
Lesson 3- Roles of the President/NC Executive Branch
Presentation
•
9th - 12th Grade
72 questions
Speciation and Natural Selection
Presentation
•
9th - 12th Grade
70 questions
En Ville
Presentation
•
9th - 12th Grade
Popular Resources on Wayground
16 questions
Grade 3 Simulation Assessment 2
Quiz
•
3rd Grade
19 questions
HCS Grade 5 Simulation Assessment_1 2526sy
Quiz
•
5th Grade
10 questions
Cinco de Mayo Trivia Questions
Interactive video
•
3rd - 5th Grade
17 questions
HCS Grade 4 Simulation Assessment_2 2526sy
Quiz
•
4th Grade
24 questions
HCS Grade 5 Simulation Assessment_2 2526sy
Quiz
•
5th Grade
13 questions
Cinco de mayo
Interactive video
•
6th - 8th Grade
20 questions
Math Review
Quiz
•
3rd Grade
30 questions
GVMS House Trivia 2026
Quiz
•
6th - 8th Grade
Discover more resources for Biology
210 questions
Unit 1 - 4 AP Bio Review
Quiz
•
9th - 12th Grade
35 questions
Biology EOC Review
Quiz
•
9th Grade
16 questions
AP Biology: Unit 1 Review (CED)
Quiz
•
9th - 12th Grade
50 questions
Biology EOC Review
Quiz
•
9th Grade
20 questions
AP Biology: Unit 3 Review (CED)
Quiz
•
9th - 12th Grade
21 questions
AP Biology: Unit 6 Review (CED)
Quiz
•
9th - 12th Grade
14 questions
AP Biology: Unit 4 Review (CED)
Quiz
•
9th - 12th Grade
15 questions
Biology EOC Review P2
Quiz
•
10th Grade