1. Q4-M5: I.I.I_Finding the Answers to the Research Questions
Presentation
•
Other
•
12th Grade
•
Hard
Edgar Monte
FREE Resource
23 Slides • 51 Questions
1
Inquiries, Investigation
and Immersion
Quarter 2 – Module 5: Finding the Answers to the Research Questions
2
What I Need to Know
This module has two lesson lessons in qualitative data analysis:
• Data Analysis method
• Interpretation of Data
3
What I Know
Multiple Choice. Write the letter of the best answer on a separate sheet of paper.
4
Multiple Choice
Which method of data analysis is used to analyze documented information in
the form of texts, media, or even physical items characteristics?
content
grounded theory
narrative
thematic
5
Multiple Choice
Which statement is related to the thematic analysis of data?
It involves looking at each case narratives
It is used in conjunction with other methods
All the views collected are summarized as the main theme
It is focused on human behavior indirectly by analyzing the way they
communicate
6
Multiple Choice
It is a process of asking questions done by the interviewer to gather
information in a form of conversation following a structured guide.
Individual Interview
Observation
Questionnaires
Vlog
7
Multiple Choice
Which of the following showed the best description of analyzing qualitative
data?
It is a random, unsystematic process.
It will start soon after all the data are being collected.
It builds from complex to specific with tangible examples.
It is a continuing and repeated process integrated into all phases of
research.
8
Multiple Choice
Which of the following is not part of qualitative data preparation and analysis?
Getting close and personal with the data
Revisiting research objectives
Identifying patterns, design, and connections
Describing the relationship between two or more variables
9
Multiple Choice
It used qualitative data to explain the occurrence of a certain phenomenon
happening by studying a variety of similar cases in a different setting and
using the data to derive causal explanations.
Content Analysis
Discourse Analysis
Grounded Theory
Framework Analysis
10
Multiple Choice
What percentage of the respondents said that the dance presentation is entertaining?
50%
60%
70%
20%
11
Multiple Choice
What percentage of the respondents said that the dance presentation is boring?
50%
60%
70%
20%
12
Multiple Choice
What percentage of the respondents said that the dance presentation is
neither entertaining nor boring?
50%
60%
70%
20%
13
Multiple Choice
Which of the following is NOT true about qualitative data interpretation?
Interpretation does not necessarily depend on the point of view of the
researcher
Interpretation of findings gives meaning to the data collected.
Interpretation of qualitative findings is a process of giving meaning to a
higher perspective.
In interpreting results, categorize responses to patterns to derive
meanings from unrelated and wordy responses
14
Multiple Choice
The following are steps in data interpretation, except for ___.
Think beyond the data
Consider the data from various perspectives
Disregard outlying data or data that seems to be an exception
Assumptions and beliefs should be made to influence your
interpretation
15
Multiple Choice
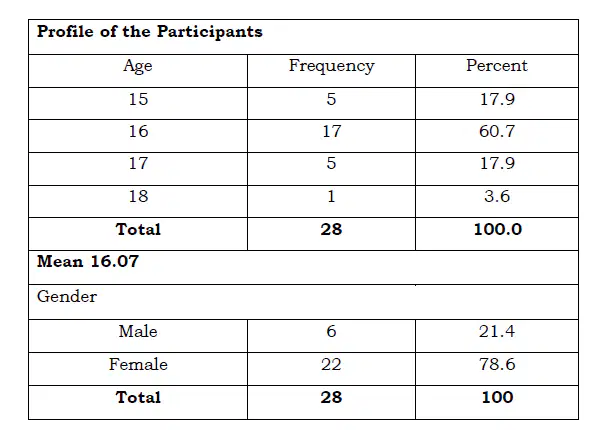
Based on the age of the respondents, what can be inferred?
Most of the Grade 10 students were at their correct age level which is
grade 10
Only 3.6% of the respondent is 18 years old
Most of the grade 10 students age is 16 years old
All of the above
16
Multiple Choice
Based on the respondent’s gender, what can be inferred?
Most of the Grade 10 students are female
Most of the Grade 10 students are male
Both A and B
None of the above
17
Multiple Choice
Based on the respondent’s gender, what can be inferred?
Most of the Grade 10 students are female
Most of the Grade 10 students are male
Both A and B
None of the above
18
Multiple Choice
Which of the following statements does NOT belong to the theme Learning Resources?
“I find some exercises a little harder because we don’t a have textbook”.
“We can research online, but we don’t have internet connectivity”
“We don’t have books to review.”
“One day in a week is not enough to handle all the modules.
19
Multiple Choice
Which of the following is not among the theme of the Responses of Grade 11
Open High Learners in Bulua National High School when asked about their
General Mathematics Subject?
Learning Resources
Students Preferences to achieve the learning
General Mathematics
Situations that Hamper Students to Achieve Learning
20
21
What’s In
Activity 1. Mix and Match!
Match the term/terms in Column A to the phrase/statement in Column B. Write your answer on a separate sheet of paper.
22
Match
Match the following
It is a conversation between the interviewer and the
interviewee to gather relevant information using
prepared questions.
These are series of questions and other prompts for
the purpose of gathering information from
respondents
It deals with an actual encounter with respondent
particular activities of the day.
It can be open or closed-ended questions
These are ideas or categories that emerge from a
grouping of lower-level data points
Individual
Interview
Questionnaires
Observation
Surveys
Themes
Individual
Interview
Questionnaires
Observation
Surveys
Themes
23
What is It
What is Data Analysis in Research?
Data analysis is a way of simplifying numerous and wordy data to a meaningful story and interpreting it to arrive at an insight to behold. It is a process of converting a multitude of data into a smaller group of sensible data.
24
What is It
What is Data Analysis in Research?
Since it is a process, it involves several stages. To start with, data must be organized. The next step is to summarize and categorize data together. Through data analysis, you can find patterns and themes to identify and link ideas. Lastly, is to really analyze data from the start to finish, or one may go backward in analyzing it.
25
What is It
What is Data Analysis in Research?
Most beginner researchers, find data analysis very tasking and time-consuming. It is very hard to navigate with data, especially if it entails vague data. However, the end result will fascinate anyone as it will bring about clear, well-structured, and meaningful data.
26
27
28
A. Define the following Common Inferential Methods
29
Open Ended
T-Tests
30
Open Ended
ANOVA
31
Open Ended
Correlation Analysis
32
Open Ended
Regression Analysis
33
B. Direction: Read and answer the questions carefully. Write and explain your answer on your answer sheet.
34
Open Ended
What type of data analysis did you use in your research paper?
35
Open Ended
Identify the methods that you used in analyzing your paper.
36
Open Ended
Whether your research used qualitative data analysis or quantitative data
analysis, present the process of analyzing you did.
37
38
39
40
41
42
What’s More
Activity 2. Fact Check!
Replace this with your body text. Duplicate this text as many times as you would like. All provided templates can be reused multiple times. Wish you a good day.
Happy teaching!
43
Multiple Choice
Data analysis describe and summarize the data.
44
Multiple Choice
Data analysis identify relationships between variables
45
Multiple Choice
Data analysis compare variables
46
Multiple Choice
Data analysis identify difference between variables
47
Multiple Choice
Data analysis forecasts outcomes.
48
What I Have Learned
Activity 3. My Take-aways!
Complete each statement below
49
Open Ended
We analyze data because
50
Open Ended
We interpret data because
51
Open Ended
I used the method in _______ (quantitative or qualitative) because
52
What I Can Do
Activity 4. Let’s try this!
1. Supposes a study is conducted to one of the stores in your barangay to determine the factors affecting customer preferences among the residences ages 22 to 60 years old. The following data were given.
53
Open Ended
Kindly give your interpretation of the given data in table 3. Write your answer on a
separate sheet of paper
54
Open Ended
Kindly write your interpretation, based on the data given in table 4. Remember to
write first the comparison and contrast of the data given, its implication to the study,
and connect it with a review of related literature.
55
Open Ended
Kindly write your interpretation, based on the data given in table 2.
56
Open Ended
Kindly write your interpretation, based on the data given in table 3. Remember to
write first the comparison and contrast of the data given, its implication to the study,
and connect it with a review of related literature.
57
Assessment
Multiple Choice. In a separate sheet of paper write the letter of the best answer.
58
Multiple Choice
Based on the age of the respondents, what can be inferred?
Most of the Grade 10 students was at their correct age level which is
grade 10
Only 3.6% of the respondent is 18 years old
Most of the grade 10 students age is 16 years old
All of the above
59
Multiple Choice
Based on the respondent’s gender, what can be inferred?
Most of the Grade 10 students are female
Most of the Grade 10 students are male
Both A and B
None of the above
60
Multiple Choice
What does quantitative data refer to?
graphs and tables.
numerical data that could usefully be quantified to help you answer
your search question(s) and to meet your objectives.
any data you present in your report.
Statistical analysis
61
Multiple Choice
Which measure of central tendency is obtained using the middle score when
all scores are organized in numerical order?
Mean
Median
Mode
None of these
62
Multiple Choice
Which measure of central tendency is obtained by calculating the sum of
values and dividing this figure by the number of values there are in the data
set?
Mean
Median
Mode
None of these
63
Multiple Choice
Which measure of central tendency is derived from the most common
value?
Mean
Median
Mode
None of these
64
Multiple Choice
What method is used to compute the average or central value of collected
data?
measures of positive variation
measures of central tendency
measures of negative skewness
measures of negative variation
65
Multiple Choice
What does standard deviation refer to?
a way of measuring the extent of spread of quantifiable data.
inappropriate in management and business research.
a way of describing those phenomena that are not the norm.
a way of illustrating crime statistics.
66
Multiple Choice
It is used to analyze content from various sources, such as interviews of
respondents, observations from the field, or surveys. It focuses on using the
stories and experiences shared by people to answer the research questions.
Content
Grounded Theory
Narrative
Thematic
67
Multiple Choice
Which method of data analysis is used to analyze documented information in
the form of texts, media, or even physical items characteristics?
Content
Grounded Theory
Narrative
Thematic
68
Multiple Choice
It is a conversation between two or more people (the interviewer and the
interviewee) where questions are asked by the interviewer to obtain
information from the interviewee following structured guidelines or pointers.
Individual Interview
Observation
Questionnaires
Vlog
69
Multiple Choice
Which statement pertains to thematic analysis of data?
It involves looking at each case narratives
It is used in conjunction with other methods
It shows the main themes that summarize all the views collected
It enables one to focus on human behavior in an indirect way by
analyzing their communication.
70
Multiple Choice
Which of the following best describes qualitative data analysis?
It is an awkward, haphazard process.
It begins after all data has been collected
It builds from abstraction to specific, concrete examples.
It is an ongoing, cyclic process integrated into all phases of research
71
Multiple Choice
Which of the following theme will best fit the question “What is the most
common reason for Students who enrolled in the Open High School?
No Smoking Policy
No plastics Policy
Working Student
No wearing of uniform
72
Multiple Choice
It is the range of processes and procedures whereby we move from the
qualitative day that has been collected and procedures whereby we move from
the qualitative data that have been collected into some form of explanation,
understanding, or interpretation of the people and situations we are
investigating.
Qualitative Data Analysis
Quantitative Data Analysis
Interpretation of Data
Data Gathering Method
73
74
Inquiries, Investigation
and Immersion
Quarter 2 – Module 5: Finding the Answers to the Research Questions
Show answer
Auto Play
Slide 1 / 74
SLIDE

Similar Resources on Wayground
68 questions
GW batteries
Presentation
•
12th Grade - University
70 questions
Unit 1 level 3
Presentation
•
University
70 questions
Review (Whole Year w/ Slides)
Presentation
•
KG - University
68 questions
bohr and lewis
Presentation
•
12th Grade
71 questions
Panayanon Literature 🪞
Presentation
•
12th Grade
72 questions
All About Senior High School
Presentation
•
University
68 questions
EMTECH Q4W4 ICT PROJECT PUBLICATION AND STATISTICS (Day 2)
Presentation
•
12th Grade
68 questions
Materi Jarak Pada Bangun Ruang
Presentation
•
12th Grade
Popular Resources on Wayground
11 questions
Hallway & Bathroom Expectations
Quiz
•
6th - 8th Grade
10 questions
HCS SCI 03 Summer School Assessment 2
Quiz
•
3rd Grade
11 questions
Home Scope
Quiz
•
7th - 8th Grade
12 questions
2026 TAP Technology in the Classroom
Presentation
•
Professional Development
15 questions
HCS SCI 05 Summer School Assessment 2 Review
Quiz
•
5th Grade
15 questions
HCS SCI 04 Summer School Review 2
Quiz
•
4th Grade
59 questions
Geometry Unit 3 Review
Quiz
•
9th - 12th Grade
14 questions
FAST ELA READING SMAPLE TEST MATERIALS
Passage
•
3rd Grade