Speed Time Graphs
Authored by George Mims
Science
10th - 12th Grade
CCSS covered
Used 281+ times

AI Actions
Add similar questions
Adjust reading levels
Convert to real-world scenario
Translate activity
More...
Content View
Student View
15 questions
Show all answers
1.
MULTIPLE CHOICE QUESTION
1 min • 1 pt

At what point is the speed the greatest?
C-D
B-C
A-B
D-E
Tags
CCSS.HSF.IF.B.4
2.
MULTIPLE CHOICE QUESTION
1 min • 1 pt

What is happening during point C to D?
not moving
increasing speed at a constant rate
moving at a constant speed
moving at 0 m/s2 acceleration
Tags
CCSS.HSF.IF.B.4
3.
MULTIPLE CHOICE QUESTION
1 min • 1 pt
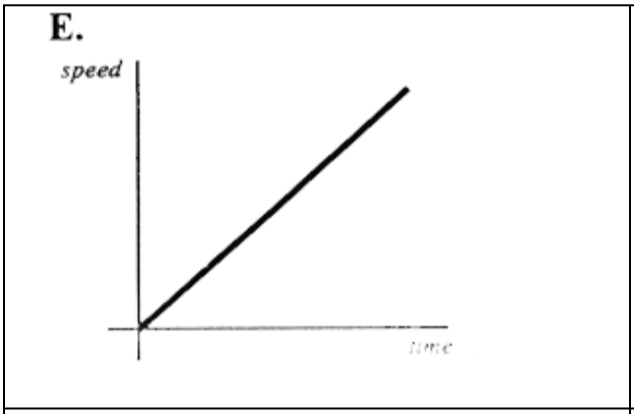
Match the graph to the description:
"The car is accelerating at a constant rate."
4.
MULTIPLE CHOICE QUESTION
1 min • 1 pt
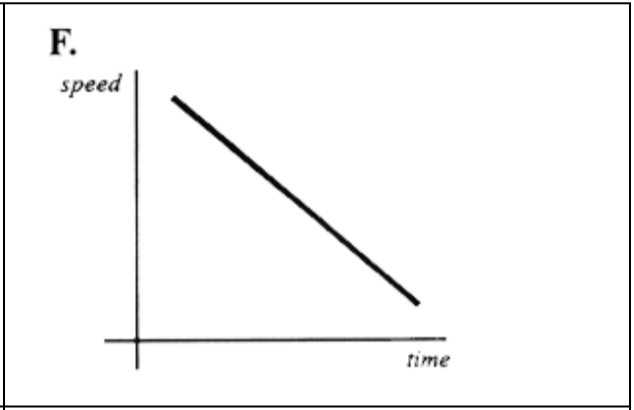
Match the graph to the description:
"The car is slowing down."
Tags
NGSS.MS-PS3-1
NGSS.MS-PS3-4
NGSS.MS-PS3-5
5.
MULTIPLE CHOICE QUESTION
1 min • 1 pt

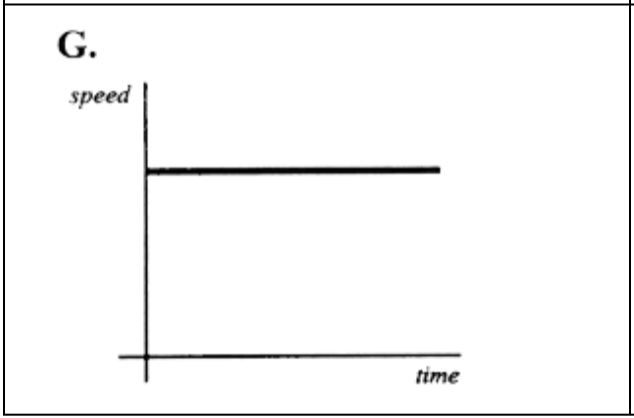
What is this graph showing?
Tags
CCSS.8.EE.B.5
6.
MULTIPLE CHOICE QUESTION
1 min • 1 pt

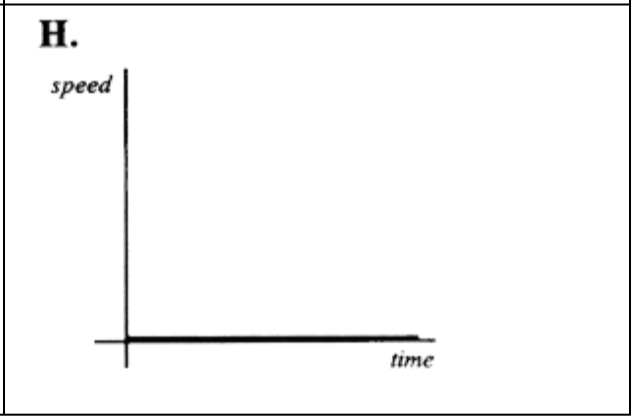
What does this graph represent?
Tags
CCSS.8.EE.B.5
7.
MULTIPLE CHOICE QUESTION
1 min • 1 pt

How long did it take Charlie to finish the race?
A)14 meters
B)12 seconds
C)17 seconds
D)14 seconds
Tags
NGSS.MS-PS3-1


Access all questions and much more by creating a free account
Create resources
Host any resource
Get auto-graded reports
Continue with Google

Continue with Email
Continue with Classlink
Continue with Clever
or continue with
Microsoft
%20(1).png)
Apple
Others
Already have an account?
