Graphing Ratios
Authored by Amy Catalano
Mathematics
6th Grade
CCSS covered
Used 4+ times

AI Actions
Add similar questions
Adjust reading levels
Convert to real-world scenario
Translate activity
More...
Content View
Student View
15 questions
Show all answers
1.
MULTIPLE CHOICE QUESTION
30 sec • 1 pt

Which point is at (6,0)
Point A
Point B
Point C
Point D
Tags
CCSS.5.G.A.2
2.
MULTIPLE CHOICE QUESTION
30 sec • 1 pt
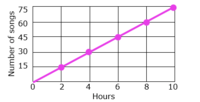
How many songs would there be in 12 hours?
80 songs
15 songs
90 songs
65 songs
Tags
CCSS.7.RP.A.2D
3.
MULTIPLE CHOICE QUESTION
30 sec • 1 pt

How much does the number of hand bags sold increase by per day?
20
15
5
1
Tags
CCSS.7.RP.A.2D
4.
MULTIPLE CHOICE QUESTION
30 sec • 1 pt

Based on the graph, how many people would there be in 7 days?
30
36
42
48
Tags
CCSS.5.OA.B.3
5.
MULTIPLE CHOICE QUESTION
1 min • 1 pt

Erasers cost 5 cents each at the school store. The table shows this relationship. Choose the graph which displays the ordered pairs and describes the graph.


Tags
CCSS.5.OA.B.3
6.
MULTIPLE CHOICE QUESTION
5 mins • 1 pt

Which statement matches the graph?
Tags
CCSS.8.EE.B.5
7.
MULTIPLE CHOICE QUESTION
30 sec • 1 pt

Using the graph given, how much money would be given at 6 hours?
$12
$8
$16
$4
Tags
CCSS.8.EE.B.5

Access all questions and much more by creating a free account
Create resources
Host any resource
Get auto-graded reports
Continue with Google

Continue with Email
Continue with Microsoft
or continue with

%20(1).png)
Apple
Others
Already have an account?
