Graphing Ratio Relationships
Authored by Anthony Clark
Mathematics
6th Grade
graphing covered
Used 1+ times

AI Actions
Add similar questions
Adjust reading levels
Convert to real-world scenario
Translate activity
More...
Content View
Student View
20 questions
Show all answers
1.
MULTIPLE CHOICE QUESTION
1 min • 1 pt

Erasers cost 5 cents each at the school store. The table shows this relationship. Choose the graph which displays the ordered pairs and describes the graph.


Tags
CCSS.8.EE.B.5
2.
MULTIPLE CHOICE QUESTION
1 min • 1 pt
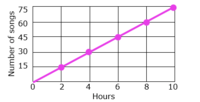
Based on the graph, how many songs would there be in 12 hours?
80 songs
15 songs
90 songs
65 songs
Tags
CCSS.HSF.LE.B.5
3.
MULTIPLE CHOICE QUESTION
1 min • 1 pt

Based on the graph, how many people would there be in 7 days?
30
36
42
48
Tags
CCSS.5.OA.B.3
4.
HOTSPOT QUESTION
1 min • 1 pt
Ross is buying hats for his baseball team. Each package contains 4 hats. Generate the set of ordered pairs for the ratio relationship between the number of hats y and the number of packages x for a total of 1, 2, 3, and 4 packages.
Select the points on the coordinate plane that correctly graph this ratio relationship.
Tags
graphing
5.
HOTSPOT QUESTION
1 min • 1 pt
Owen is getting books for his music classes. Each class requires 3 books. Generate the set of ordered pairs for the ratio relationship between the number of books y and the number of classes x for a total of 1, 2, 3, and 4 classes.
Select the points on the coordinate plane that correctly graph this ratio relationship.
Tags
graphing
6.
HOTSPOT QUESTION
1 min • 1 pt
A scenic train travels about 40 miles every hour. Generate the set of ordered pairs for the ratio relationship between the total distance traveled y and the number of hours x for a total of 1, 2, 3, and 4 hours. Then graph the relationship on the coordinate plane and describe the pattern in the graph.
Select the points on the coordinate plane that correctly graph this ratio relationship.
Tags
graphing
7.
HOTSPOT QUESTION
1 min • 1 pt
Logan swims about 2.5 laps every minute in his pool. Generate the set of ordered pairs for the ratio relationship between the total number of laps y and the number of minutes x for a total of 1, 2, 3, and 4 minutes.
Select the points on the coordinate plane that correctly graph this ratio relationship.
Tags
graphing

Access all questions and much more by creating a free account
Create resources
Host any resource
Get auto-graded reports
Continue with Google

Continue with Email
Continue with Classlink
Continue with Clever
or continue with
Microsoft
%20(1).png)
Apple
Others
Already have an account?
Similar Resources on Wayground

15 questions
Year 10 Solving Equations
Quiz
•
9th - 11th Grade
16 questions
Area of right angled and non right angled triangles
Quiz
•
10th Grade
16 questions
Week 6 Review Quiz
Quiz
•
6th Grade
16 questions
Math 6 - Ratios Review
Quiz
•
6th Grade
20 questions
1G Multiplication & Division (Negatives)
Quiz
•
8th - 10th Grade
15 questions
KLA2, Nando M06-07-09, Herhalingsoefeningen EX2
Quiz
•
8th Grade
15 questions
6INT Math Spring Final Review
Quiz
•
6th Grade
15 questions
Absolute Value and Integers
Quiz
•
6th - 7th Grade
Popular Resources on Wayground
15 questions
Fractions on a Number Line
Quiz
•
3rd Grade
10 questions
Probability Practice
Quiz
•
4th Grade
15 questions
Probability on Number LIne
Quiz
•
4th Grade
20 questions
Equivalent Fractions
Quiz
•
3rd Grade
25 questions
Multiplication Facts
Quiz
•
5th Grade
22 questions
fractions
Quiz
•
3rd Grade
6 questions
Appropriate Chromebook Usage
Lesson
•
7th Grade
10 questions
Greek Bases tele and phon
Quiz
•
6th - 8th Grade
Discover more resources for Mathematics
20 questions
Writing Algebraic Expressions
Quiz
•
6th Grade
20 questions
Ratios/Rates and Unit Rates
Quiz
•
6th Grade
20 questions
Graphing Inequalities on a Number Line
Quiz
•
6th - 9th Grade
20 questions
One Step Equations
Quiz
•
6th Grade
12 questions
One-Step Equations
Quiz
•
6th Grade
6 questions
Equations from models
Quiz
•
6th Grade
15 questions
Equivalent Ratios
Quiz
•
6th Grade
20 questions
Writing Ratios & Identifying Equivalent Ratios
Quiz
•
6th Grade