Graphing Absolute Value Functions with Attributes
Authored by Anthony Clark
Mathematics
9th Grade
CCSS covered

AI Actions
Add similar questions
Adjust reading levels
Convert to real-world scenario
Translate activity
More...
Content View
Student View
20 questions
Show all answers
1.
MULTIPLE CHOICE QUESTION
1 min • 1 pt

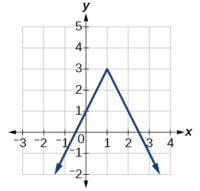
What is the vertex?
(1, 4)
(4, 1)
(0, 0)
(0, 1)
2.
MULTIPLE CHOICE QUESTION
1 min • 1 pt

What is the axis of symmetry?
y = 50
x = 15
x = 50
y = 15
Tags
CCSS.HSF-IF.C.7D
3.
MULTIPLE CHOICE QUESTION
1 min • 1 pt
The function
f(t) = -2|t - 15| + 50
is graphed and represents weekly sales of shoes, f(t) in $1000s, where t is weeks. What is the domain for this graph?
0 ≤ t ≤ 40
0 ≤ t ≤ ∞
20 ≤ t ≤ 40
-∞ ≤ t ≤ 50
Tags
CCSS.8.F.A.1
CCSS.HSF.IF.B.5
4.
MULTIPLE CHOICE QUESTION
1 min • 1 pt

Observe the graph. What is the MINIMUM value on the interval [0,5]?
-1
1
-3
3
Tags
CCSS.HSF-IF.C.7D
5.
MATH RESPONSE QUESTION
1 min • 1 pt

Mathematical Equivalence
OFF
Tags
CCSS.HSF-IF.C.7D
6.
MULTIPLE CHOICE QUESTION
1 min • 1 pt

What is the domain of the absolute value function?
(4, 0)
(0, 4)
Tags
CCSS.8.F.A.1
CCSS.HSF.IF.B.5
7.
MULTIPLE CHOICE QUESTION
1 min • 1 pt

What is the range of the absolute value function?
Tags
CCSS.8.F.A.1
CCSS.HSF.IF.B.5

Access all questions and much more by creating a free account
Create resources
Host any resource
Get auto-graded reports
Continue with Google

Continue with Email
Continue with Classlink
Continue with Clever
or continue with
Microsoft
%20(1).png)
Apple
Others
Already have an account?
