Algebra Unit 7 Test Review
Authored by Justin Hockey
Mathematics
9th Grade
CCSS covered
Used 12+ times

AI Actions
Add similar questions
Adjust reading levels
Convert to real-world scenario
Translate activity
More...
Content View
Student View
12 questions
Show all answers
1.
MULTIPLE SELECT QUESTION
2 mins • 1 pt

The amount of miles that Janice and David have each driven over the past 5 days is shown below.
Which of the following statements are true? Select two that apply.
David's set of data has a higher standard deviation than Janice's
David's set of data has a higher mean than Janice's.
Janice's set of data has a higher median than David's.
Janice's set of data has a higher interquartile range than David's.
Tags
CCSS.7.SP.B.4
2.
MULTIPLE CHOICE QUESTION
2 mins • 1 pt

A math teacher at George Washington Middle School asked boys in the 6th and 7th grades to report their shoe size. She used the results to create these histograms.
Which conclusion is best supported by the histograms?
As boys get older, shoe sizes increase and the distribution remains relatively unchanged.
As boys get older, shoe size range, defined by the minimum and maximum, decreases.
As boys get older, shoe sizes become more normally distributed with fewer large outliers.
As boys get older, shoe size distribution becomes more spread with more large outliers.
Tags
CCSS.6.SP.A.2
3.
MULTIPLE SELECT QUESTION
2 mins • 1 pt

The data set shown by the dot plot represents the ages of the boys on a baseball team.
A new boy, who is 8, joined the baseball team after the dot plot was made.
Select TWO statements that are true.
The mean age decreased when the new boy joined the team
The mean age did not change when the new boy joined the team
The median age decreased when the new boy joined the team.
The median age did not change when the new boy joined the team.
The standard deviation decreased when the new boy joined the team
4.
MULTIPLE SELECT QUESTION
2 mins • 1 pt
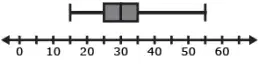
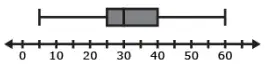
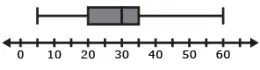
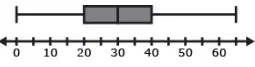
The "1.5 × IQR" rule states that a data value is potentially an outlier if its distance below the first quartile or above the third quartile is greater than 1.5 times the interquartile range. Which of the following box plots represent a data set with a potential outlier, as identified by the "1.5 × IQR" rule? Select two that apply.
5.
MULTIPLE SELECT QUESTION
2 mins • 1 pt

The scatter plot represents the probability of taking a family trip by car given the price of fuel per gallon.
Which of the statements are true? Choose the THREE correct answers.
There are no outliers in the scatter plot.
The results are less clustered at values in the $2.25 to $2.60 per gallon range.
The relationship between price per gallon and probability of travel is linear.
When price per gallon is $2.70 or higher, there is no relationship between the price and the probability of travel
When the price per gallon is less than $2.70, the relationship between price per gallon and probability of travel is negative.
Tags
CCSS.HSF-LE.A.1B
6.
MULTIPLE CHOICE QUESTION
2 mins • 1 pt

The regression line below predicts a student’s GPA (grade point average) from the number of hours a student spends playing video games during the school year.
What is the slope of the regression line in the context of the problem?
A student’s GPA goes down approximately 1 point for every 10 hours spent playing video games.
A student’s GPA goes down approximately 10 points for every hour spent playing video games.
A student’s GPA goes down approximately 10 points for every 3 hours spent playing video games.
A student’s GPA goes down approximately 3 points for every 10 hours spent playing video games.
Tags
CCSS.HSF.LE.B.5
7.
MULTIPLE CHOICE QUESTION
2 mins • 1 pt
A researcher is studying the relationship between the number of TVs owned by a family and the size of the family's electric bill. After collecting data, he finds that the relationship is best modeled by the equation B = 2.43T + 95.66, where B is one month's electric bill in dollars and T is the number of TVs owned by the family. Which of these is a good interpretation of the y-intercept of this model?
A family with no TVs has a typical electric bill of $95.66.
A family with no TVs has a typical electric bill of $2.43.
For each additional TV owned by the family, the electric bill increases by about $2.43.
For each additional TV owned by the family, the electric bill increases by about $95.66.
Tags
CCSS.HSF.LE.B.5


Access all questions and much more by creating a free account
Create resources
Host any resource
Get auto-graded reports
Continue with Google

Continue with Email
Continue with Classlink
Continue with Clever
or continue with
Microsoft
%20(1).png)
Apple
Others
Already have an account?
