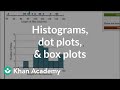
Comparing Data Displays: Dot Plots, Histograms, and Box Plots
Interactive Video
•
Mathematics
•
6th - 10th Grade
•
Practice Problem
•
Medium
+1
Standards-aligned

Lucas Foster
Used 8+ times
FREE Resource
Standards-aligned
10 questions
Show all answers
1.
MULTIPLE CHOICE QUESTION
30 sec • 1 pt
How many Pixar films had a running time of 96 minutes?
4
3
2
1
Tags
CCSS.3.MD.B.4
2.
MULTIPLE CHOICE QUESTION
30 sec • 1 pt
Can a dot plot be used to list all values in a dataset?
Not mentioned
Yes
No
Only if the dataset is small
Tags
CCSS.6.SP.B.4
CCSS.HSS.ID.A.1
3.
MULTIPLE CHOICE QUESTION
30 sec • 1 pt
Why can't a histogram be used to find the exact median?
All of the above
It only displays ranges
It doesn't show individual data points
It's not detailed enough
Tags
CCSS.6.SP.B.4
CCSS.HSS.ID.A.1
4.
MULTIPLE CHOICE QUESTION
30 sec • 1 pt
What limitation does a histogram have compared to a dot plot?
Cannot show exact values
Cannot be used for statistical analysis
Cannot show median directly
Cannot display large datasets
5.
MULTIPLE CHOICE QUESTION
30 sec • 1 pt
What does the middle line in a box plot represent?
Range
Mode
Median
Mean
Tags
CCSS.6.SP.B.4
CCSS.HSS.ID.A.1
6.
MULTIPLE CHOICE QUESTION
30 sec • 1 pt
Which display method explicitly shows the median value?
Dot plot
Box plot
Histogram
None of the above
7.
MULTIPLE CHOICE QUESTION
30 sec • 1 pt
Which type of data representation is best for finding the median?
Box plot
All of the above
Histogram
Dot plot
Access all questions and much more by creating a free account
Create resources
Host any resource
Get auto-graded reports
Continue with Google

Continue with Email
Continue with Microsoft
or continue with

%20(1).png)
Apple
Others
Already have an account?
