Understanding Graphing Functions and Derivatives
Interactive Video
•
Mathematics
•
9th - 12th Grade
•
Practice Problem
•
Hard
Standards-aligned

Emma Peterson
FREE Resource
Standards-aligned
Read more
10 questions
Show all answers
1.
MULTIPLE CHOICE QUESTION
30 sec • 1 pt
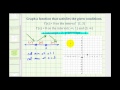
What is the behavior of the function's derivative on the interval from one to three?
The derivative is zero.
The derivative is positive.
The derivative is negative.
The derivative is undefined.
Tags
CCSS.HSF.IF.B.4
2.
MULTIPLE CHOICE QUESTION
30 sec • 1 pt
Where is the function's derivative negative?
From one to three.
From negative infinity to one and from three to infinity.
Only at x equals two.
From zero to two.
3.
MULTIPLE CHOICE QUESTION
30 sec • 1 pt
What does the first derivative tell us about a function?
The function's color.
The function's intercepts.
Whether the function is increasing or decreasing.
The function's domain.
4.
MULTIPLE CHOICE QUESTION
30 sec • 1 pt
What is indicated by a change from decreasing to increasing in a function?
A constant function.
A point of inflection.
A relative minimum.
A relative maximum.
5.
MULTIPLE CHOICE QUESTION
30 sec • 1 pt
What are the given intercepts of the function?
X-intercept at 2 and Y-intercept at -1.
X-intercept at 3 and Y-intercept at 1.
X-intercept at -1 and Y-intercept at 2.
X-intercept at 0 and Y-intercept at 0.
6.
MULTIPLE CHOICE QUESTION
30 sec • 1 pt
What happens to the function at x equals 3?
It becomes undefined.
It reaches a relative maximum.
It intersects the y-axis.
It reaches a relative minimum.
7.
MULTIPLE CHOICE QUESTION
30 sec • 1 pt
What is the function's behavior to the left of the y-intercept?
It is constant.
It is increasing.
It is decreasing.
It is oscillating.
Access all questions and much more by creating a free account
Create resources
Host any resource
Get auto-graded reports
Continue with Google

Continue with Email
Continue with Classlink
Continue with Clever
or continue with
Microsoft
%20(1).png)
Apple
Others
Already have an account?
